Summary of October-November 2015 South Carolina King Tides
Highest Predicted Tide: 7.2′
Highest Observed Tide: 8.7′
Predicted King Tides: 6
Observed King Tides: 14

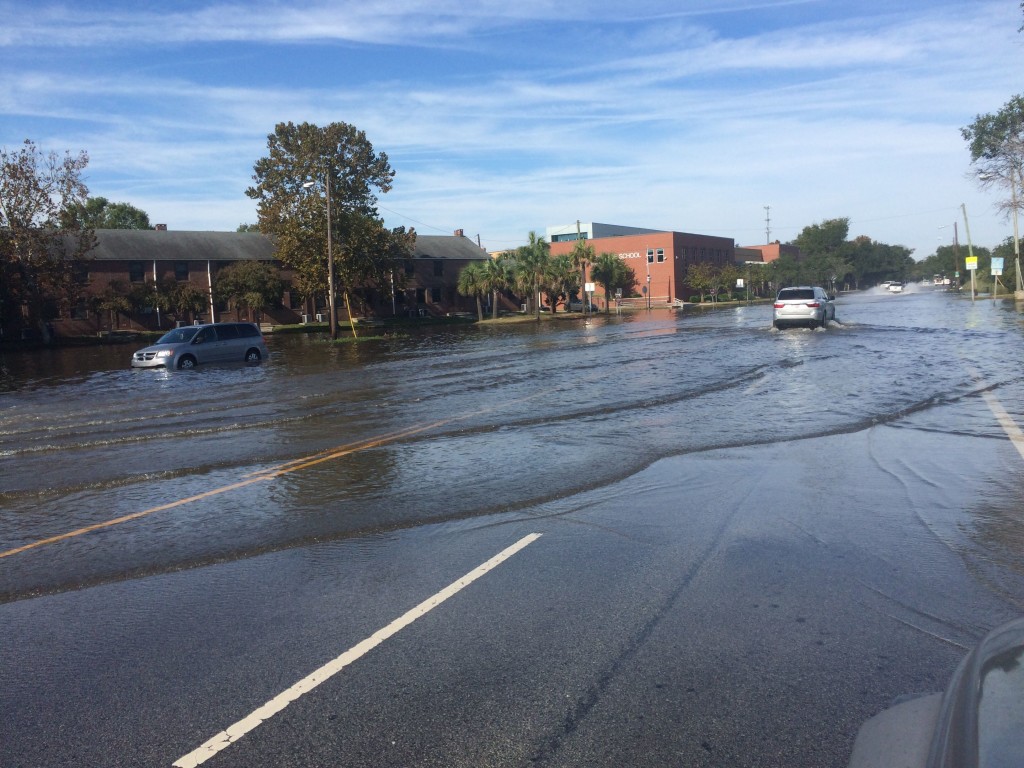
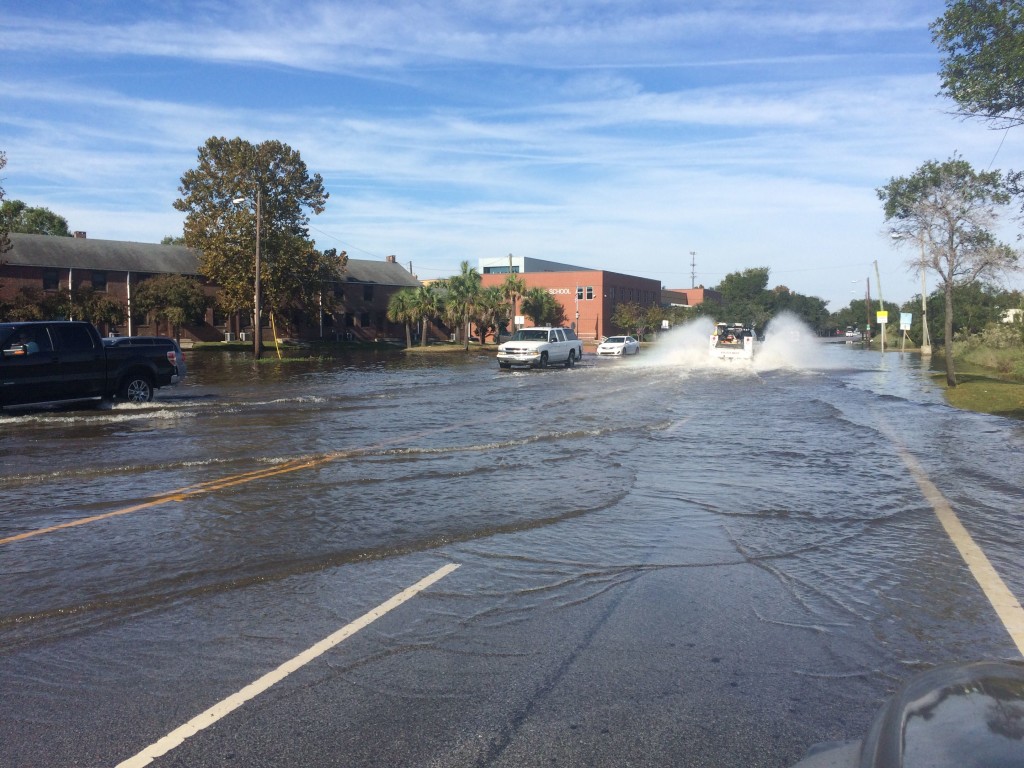
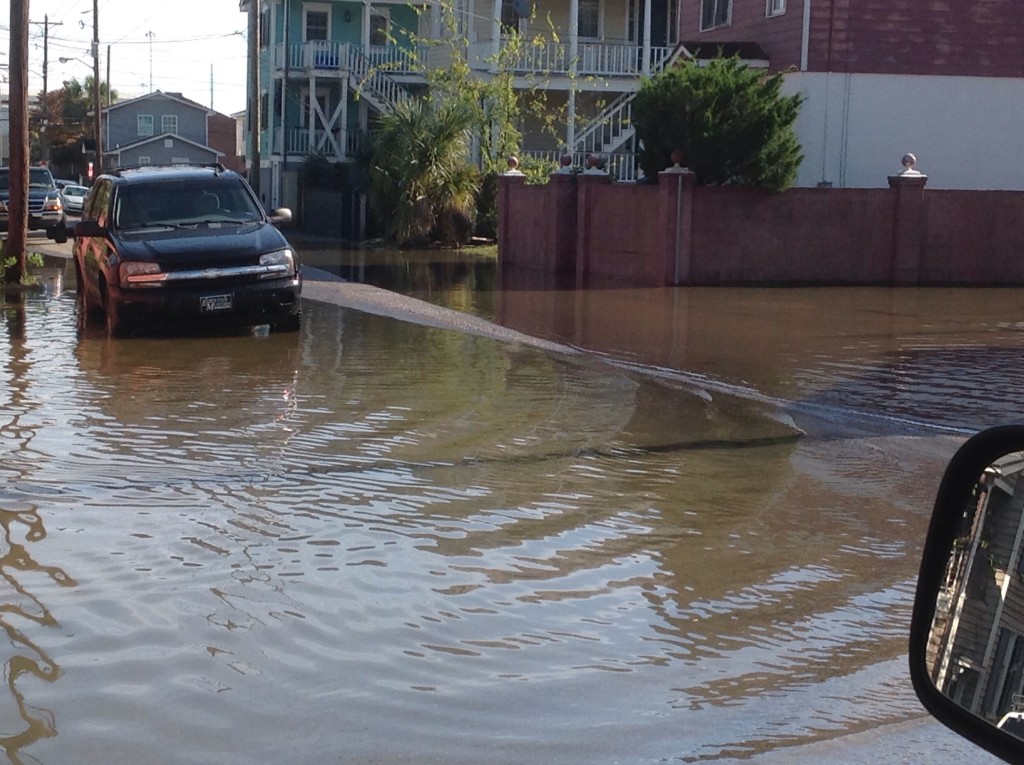
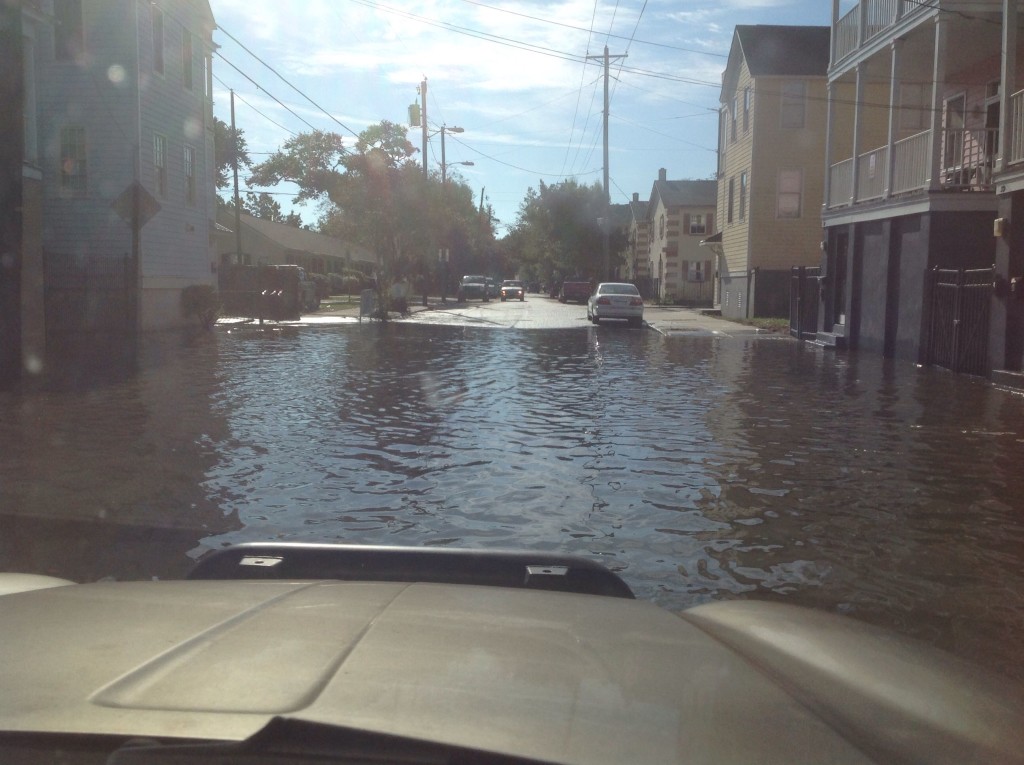
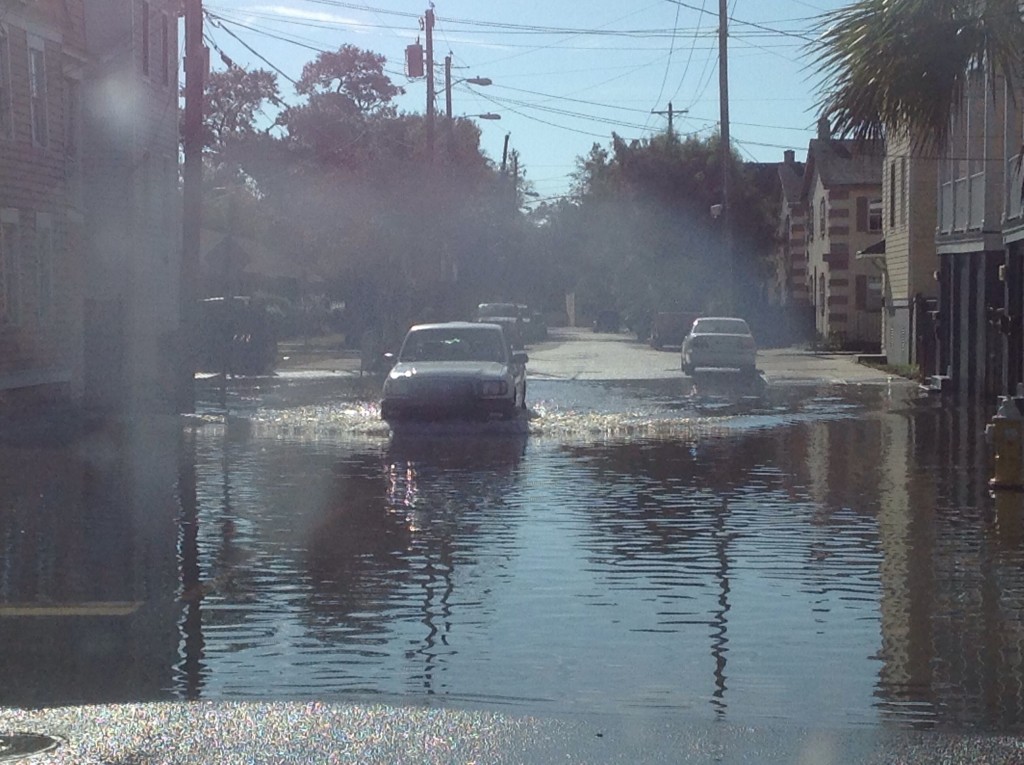
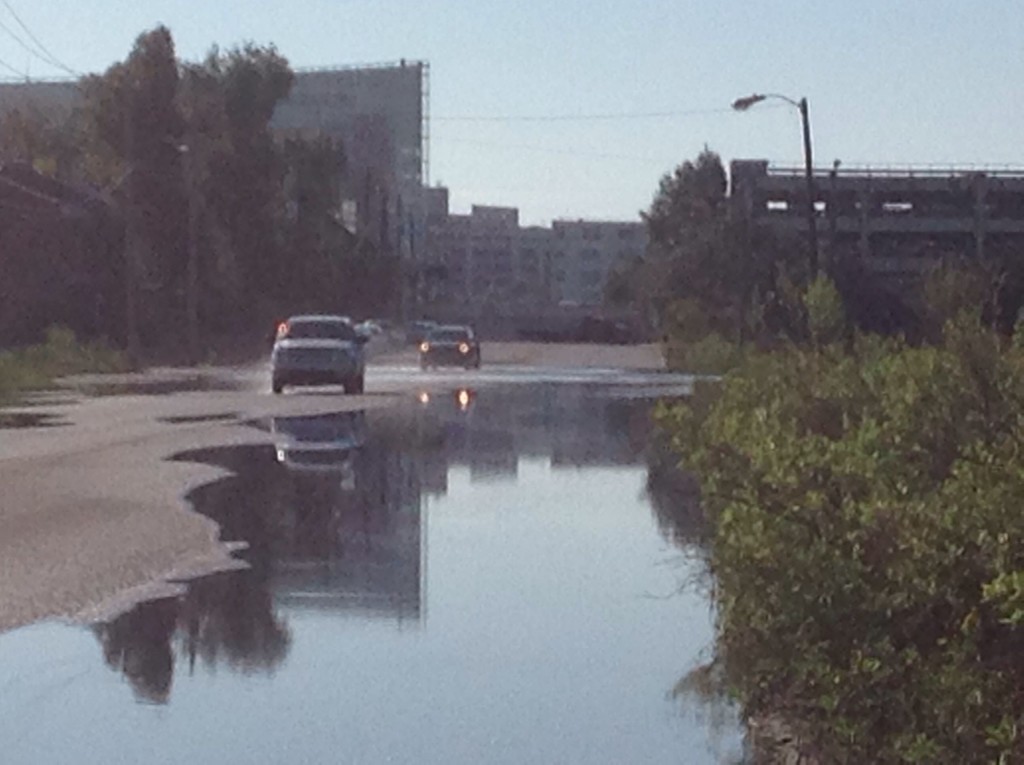
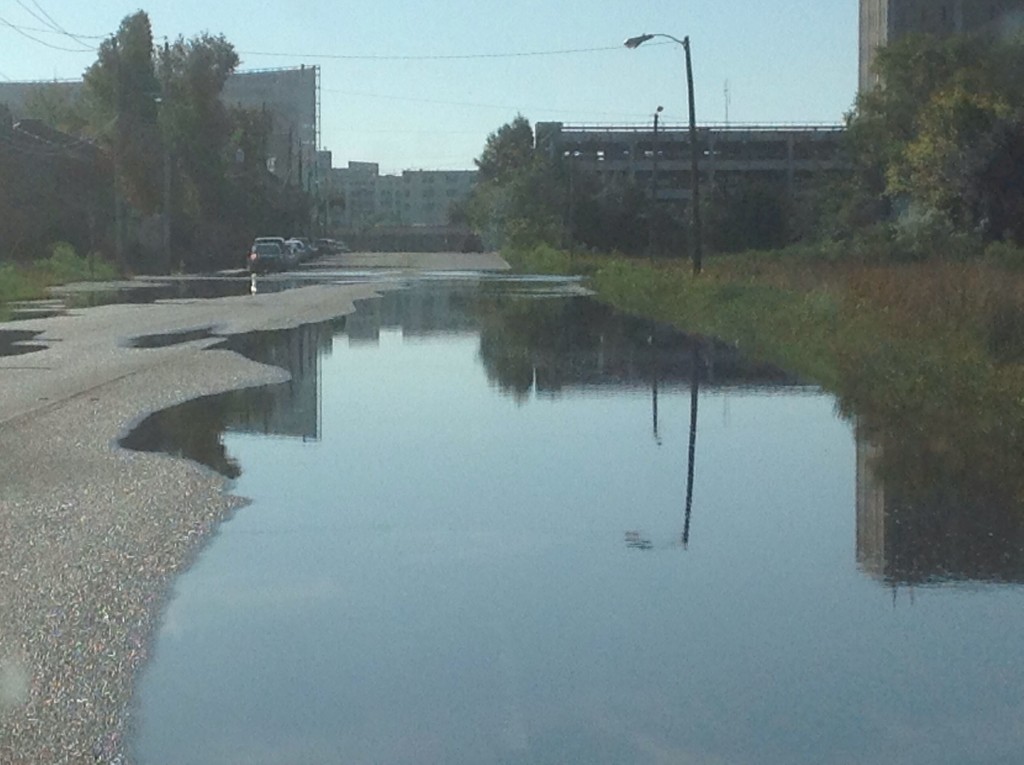
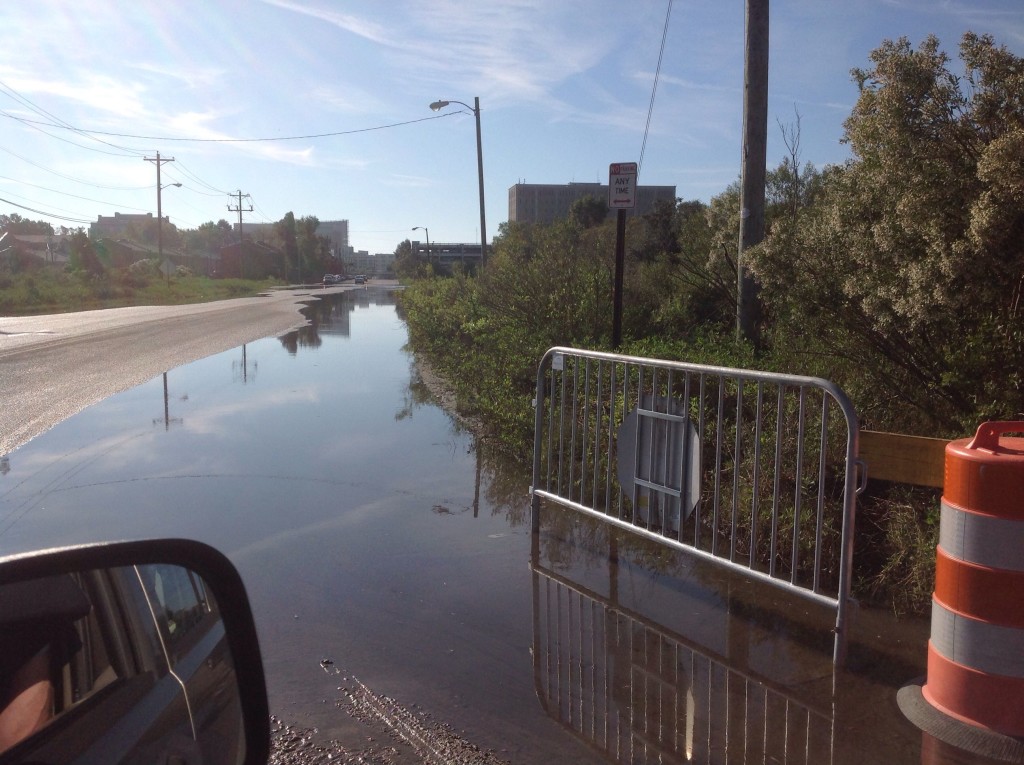
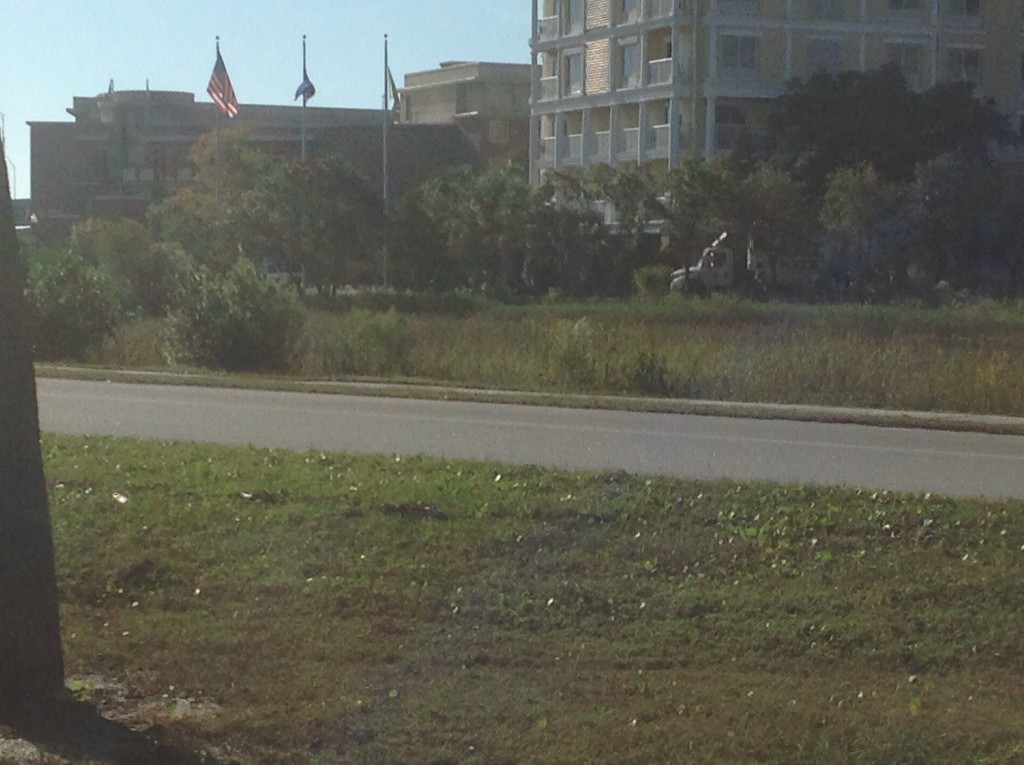
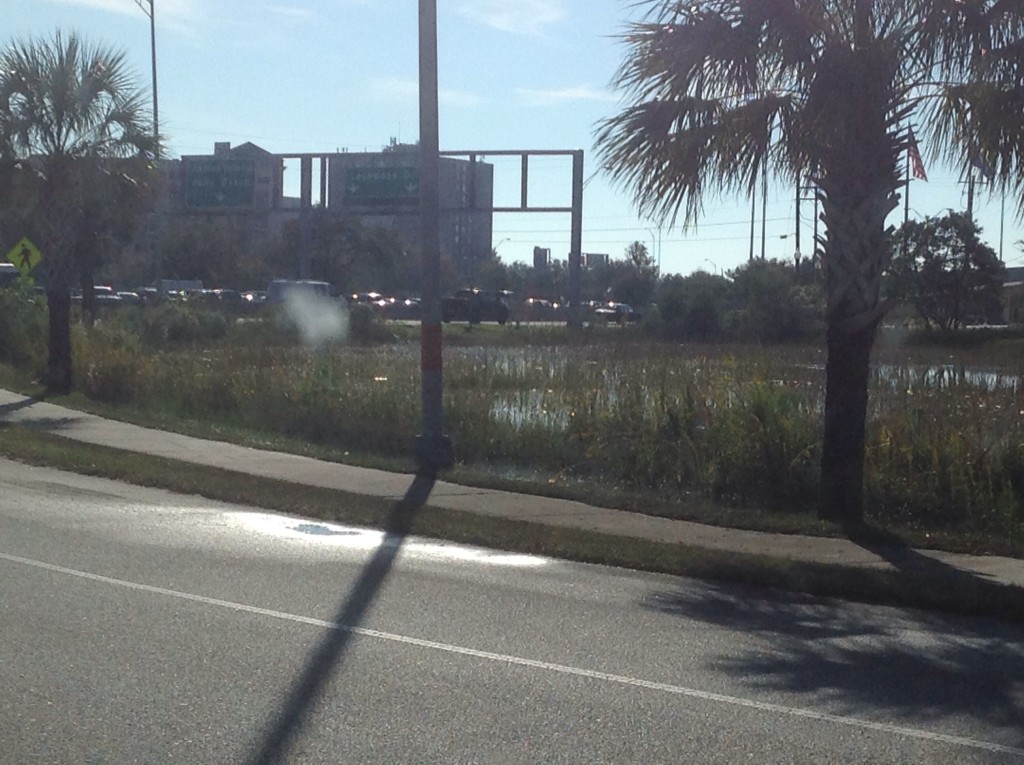
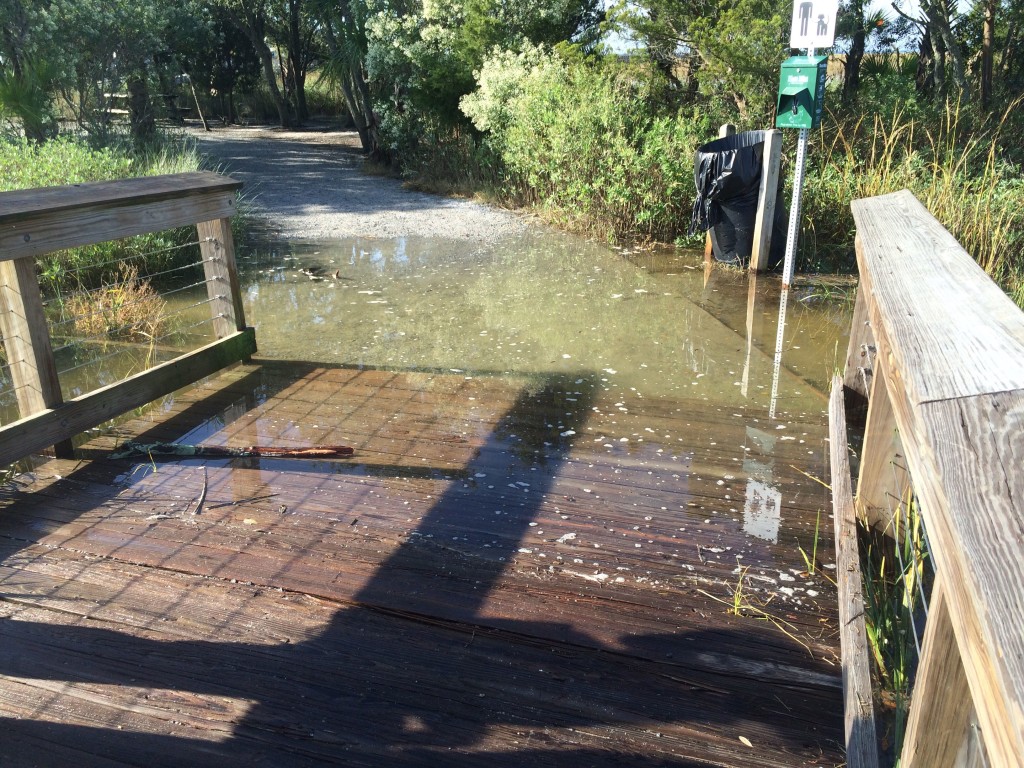
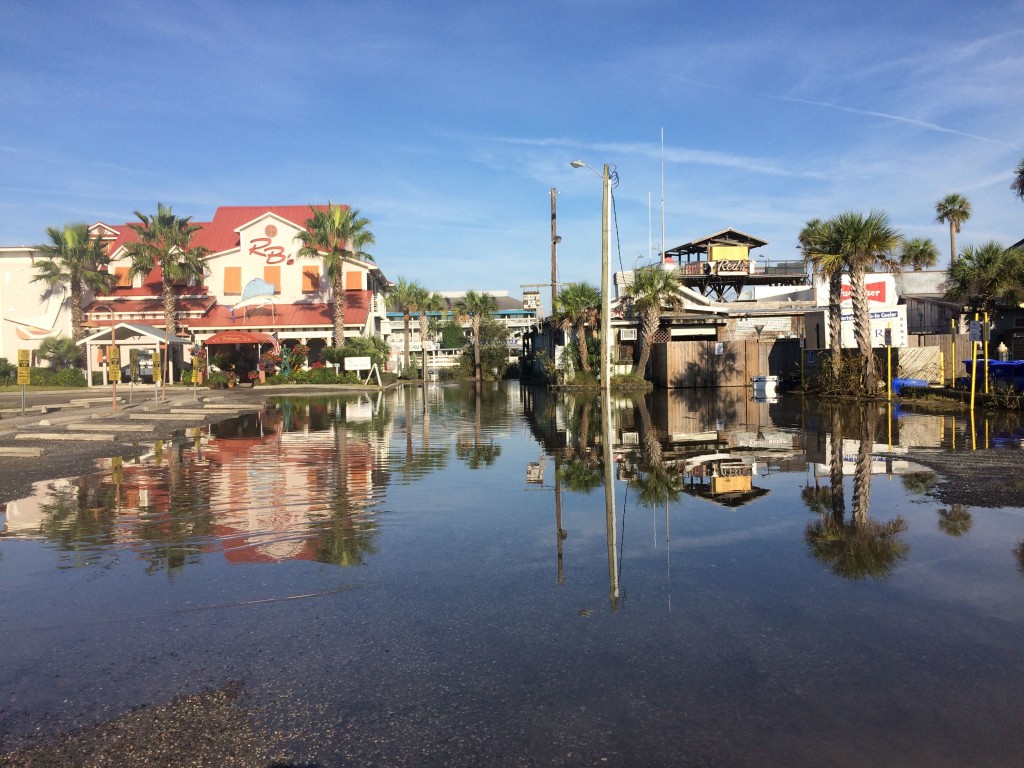
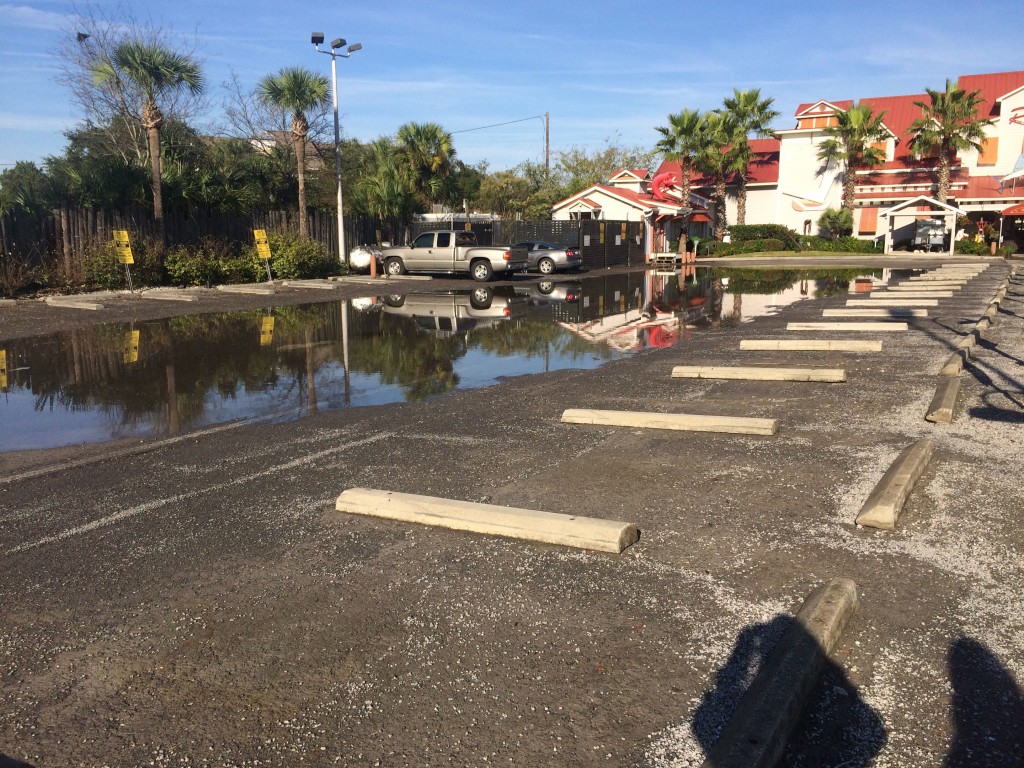
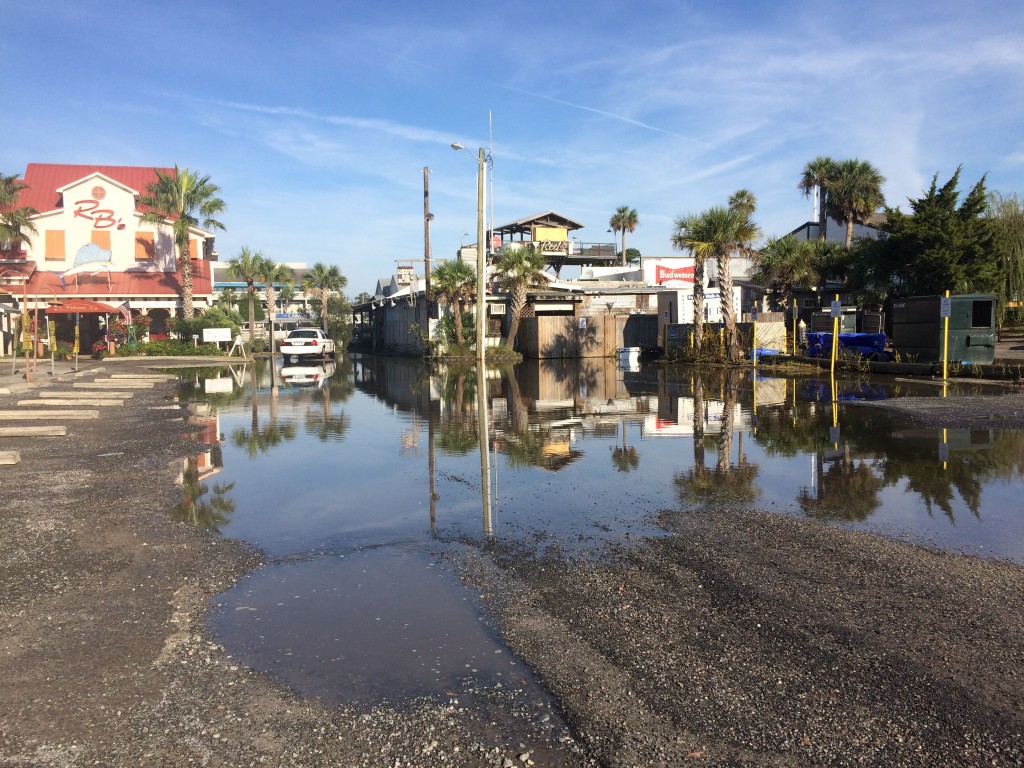
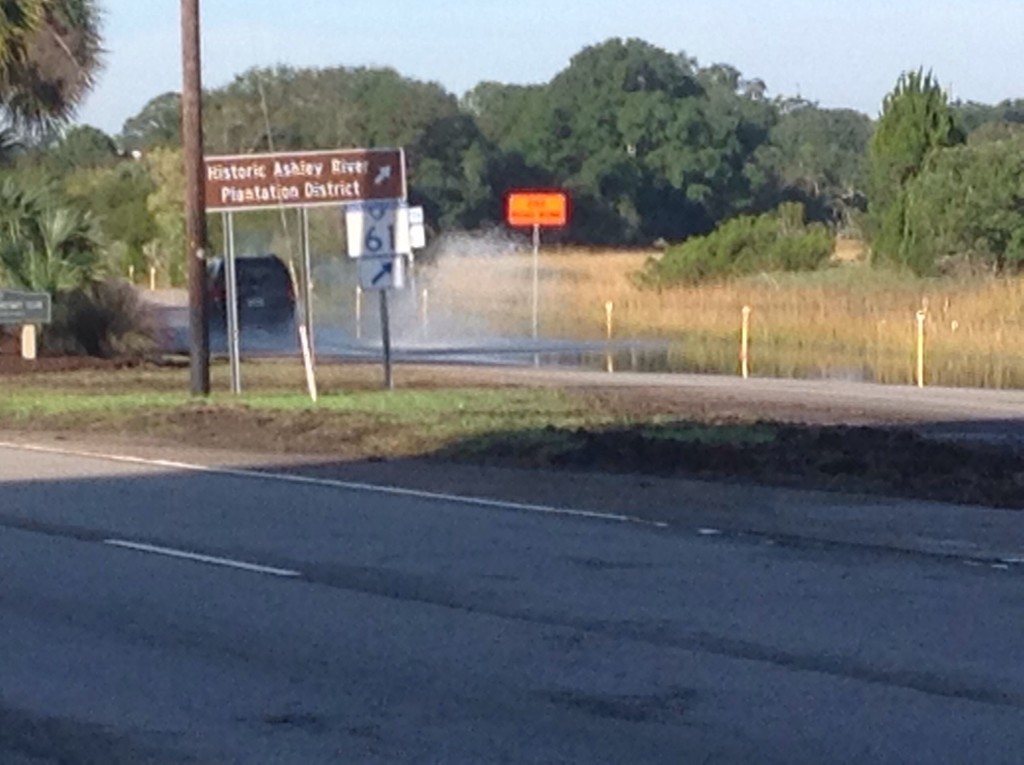
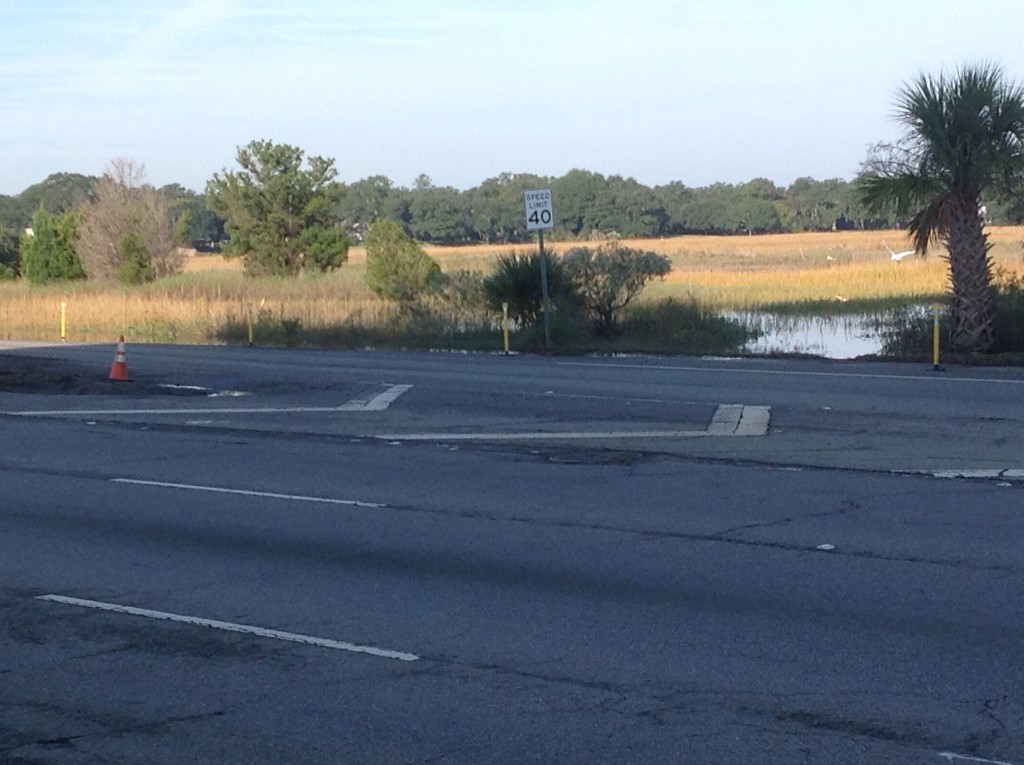
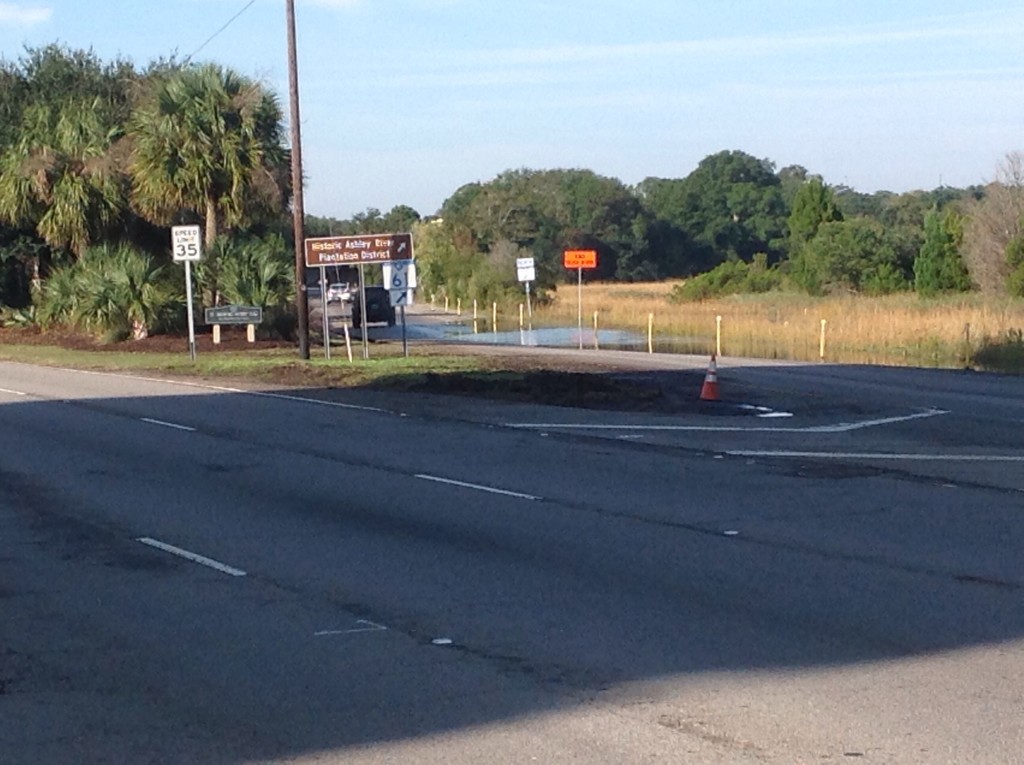
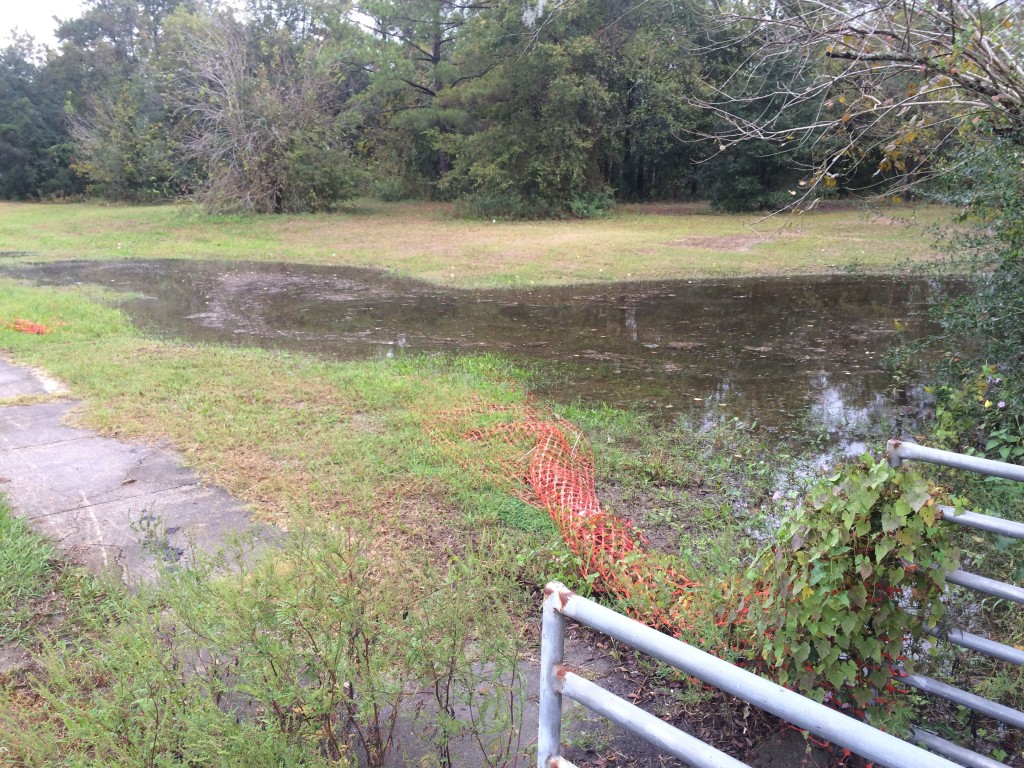
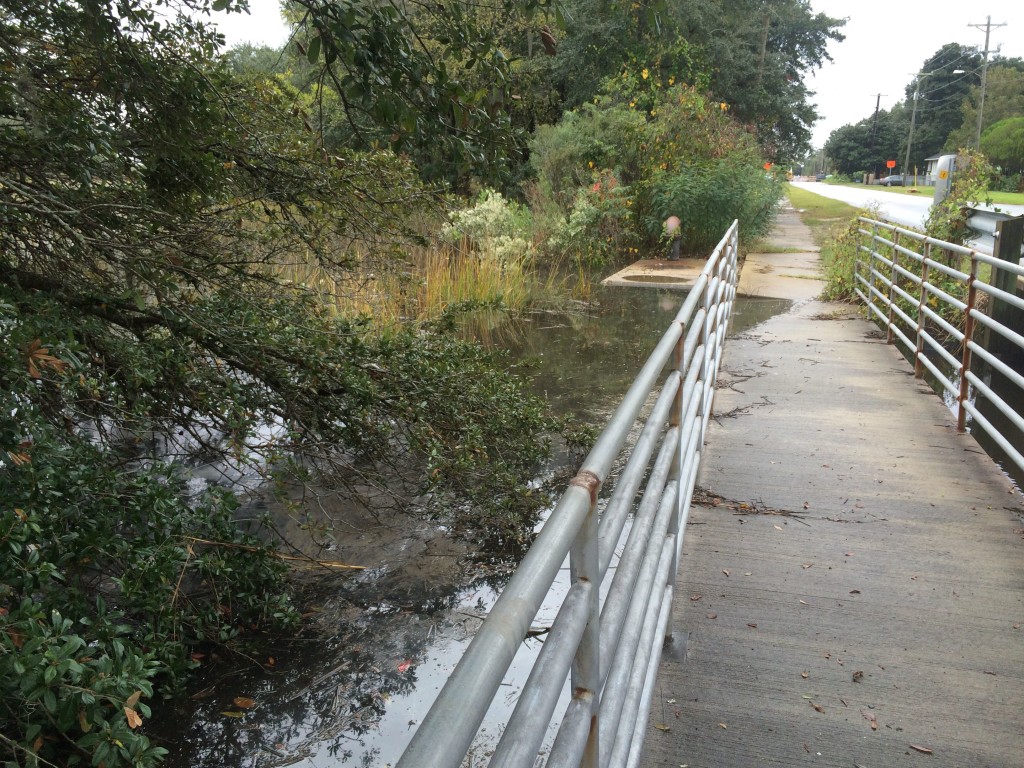
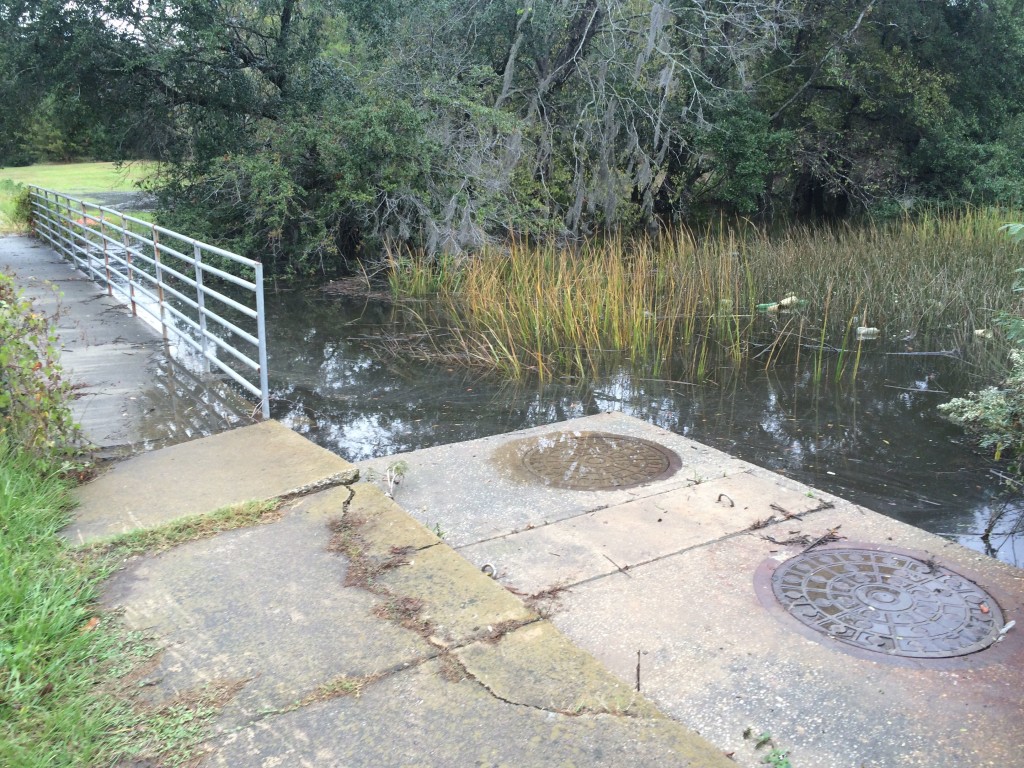
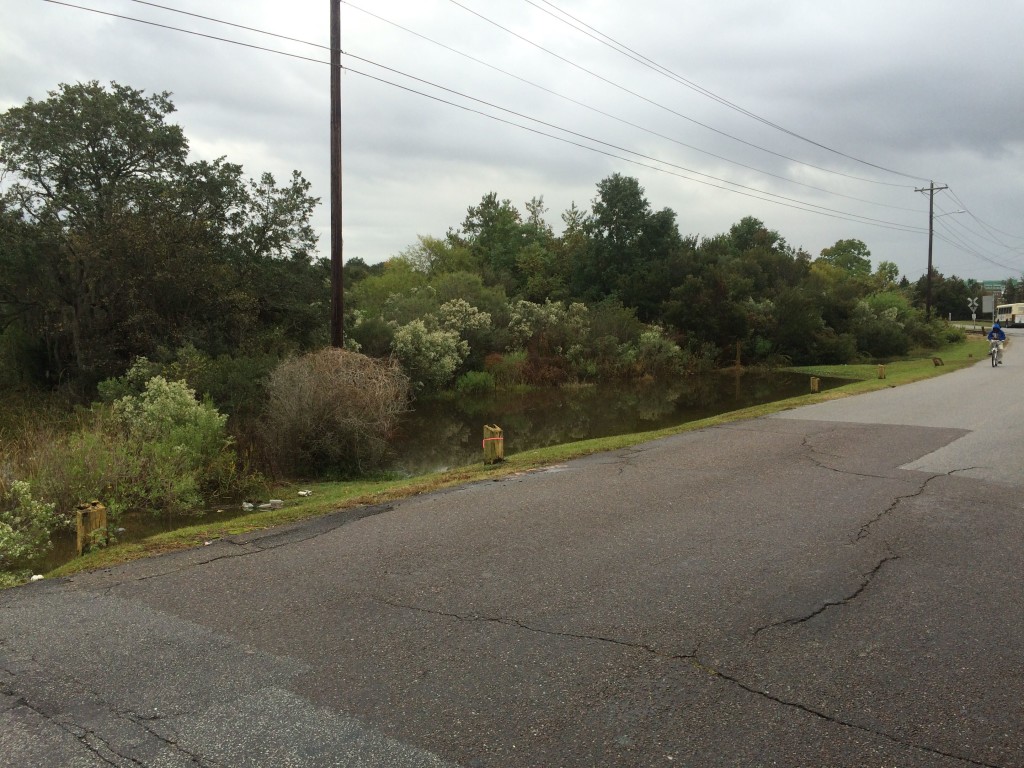
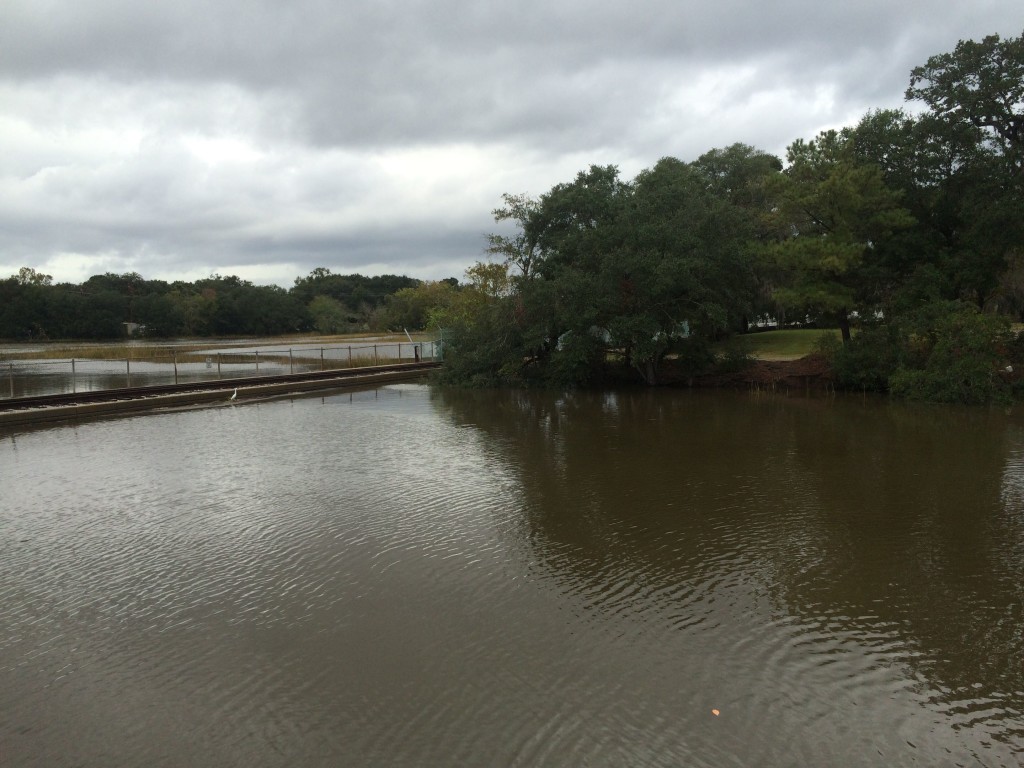
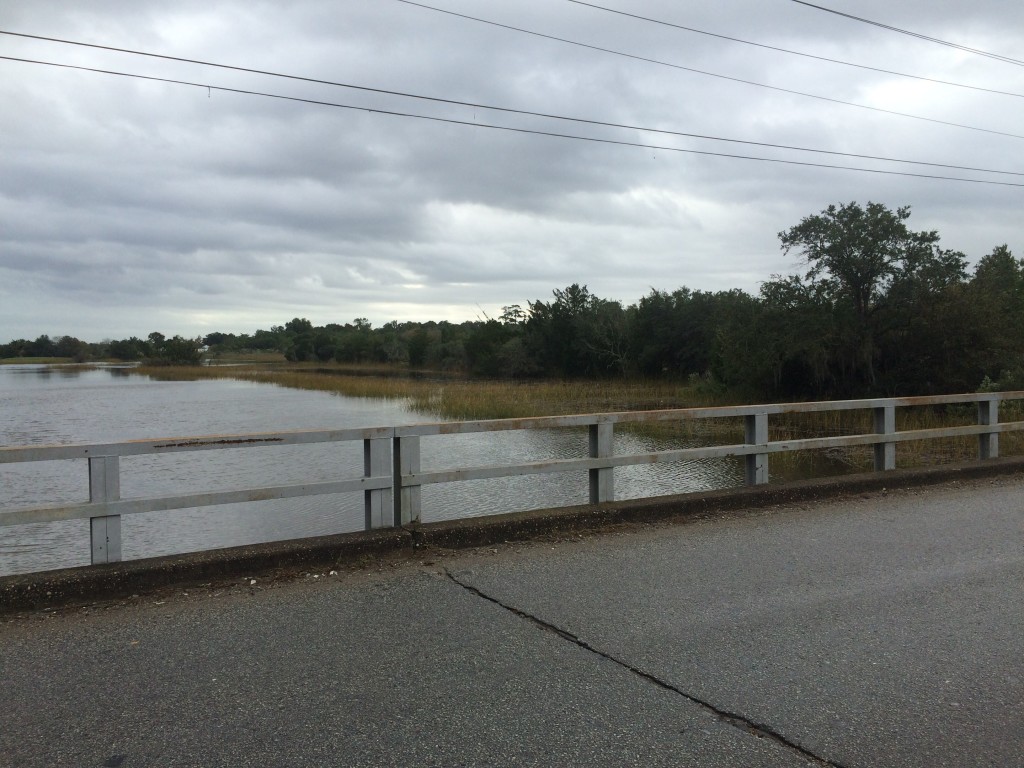
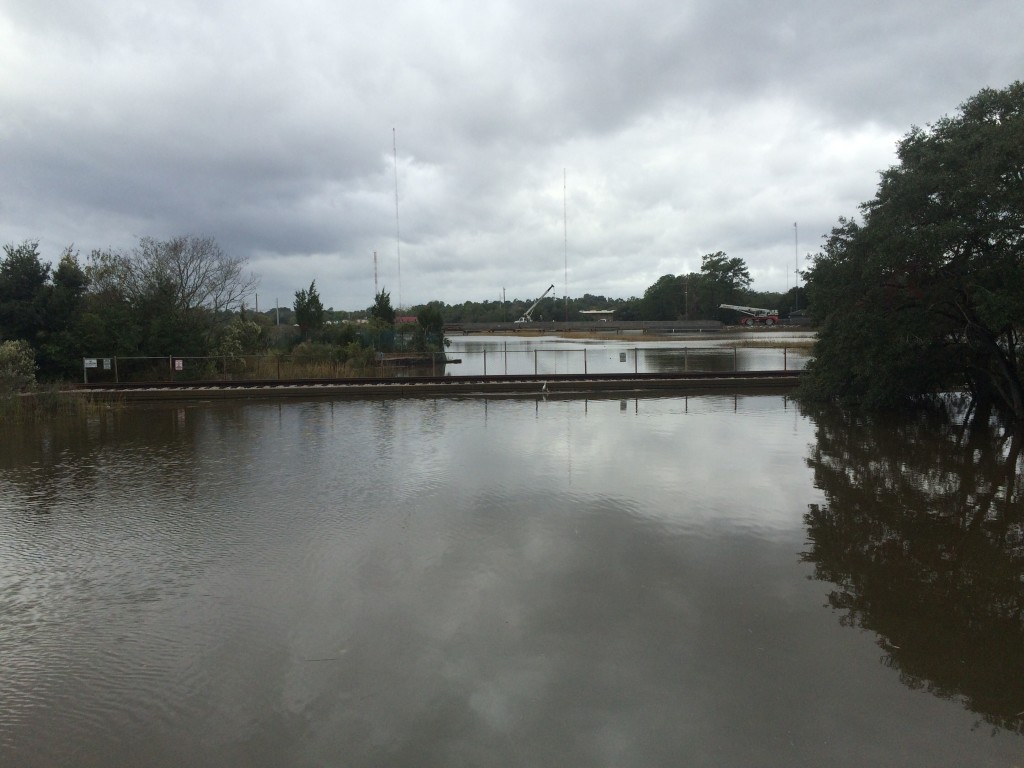
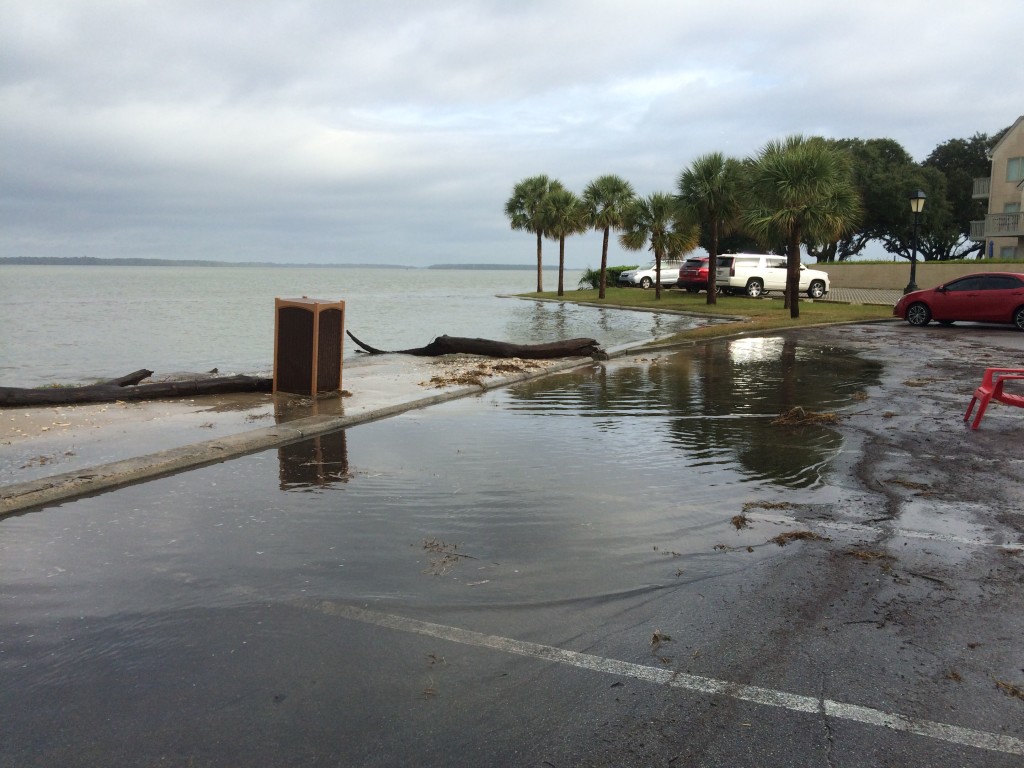
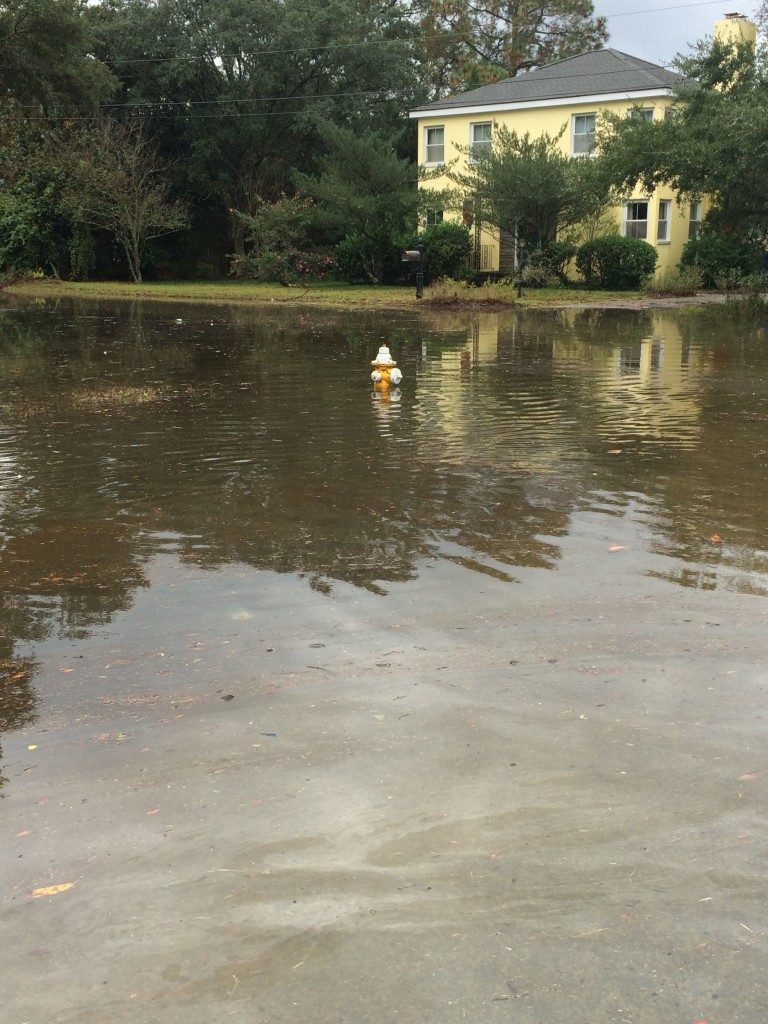
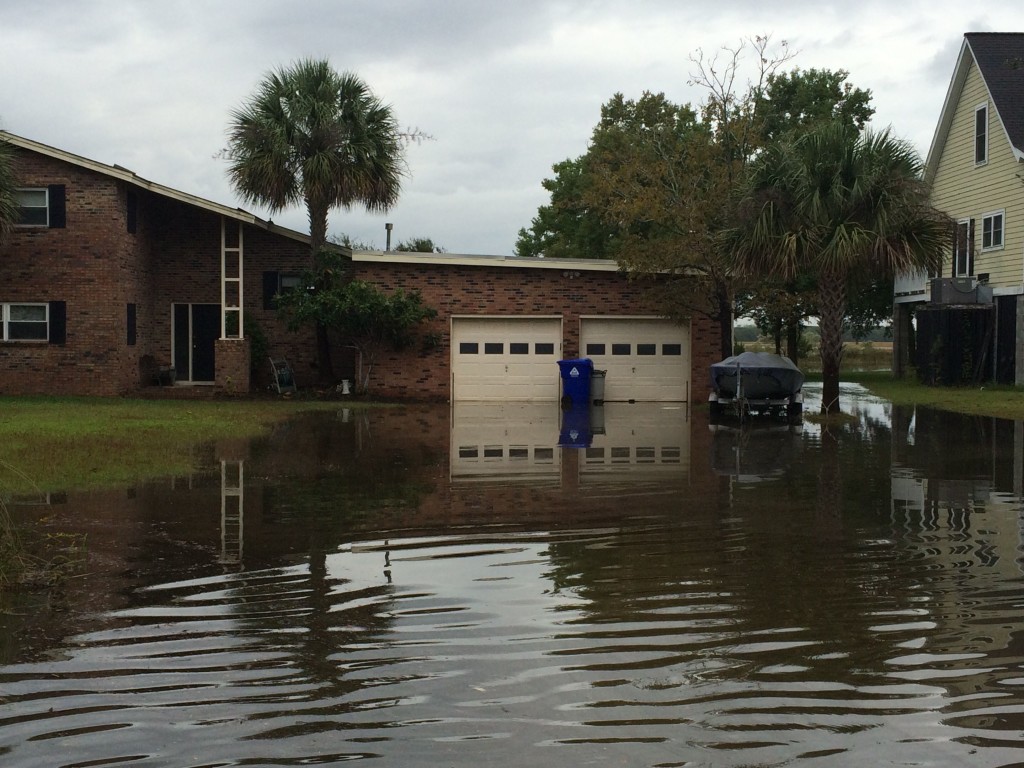
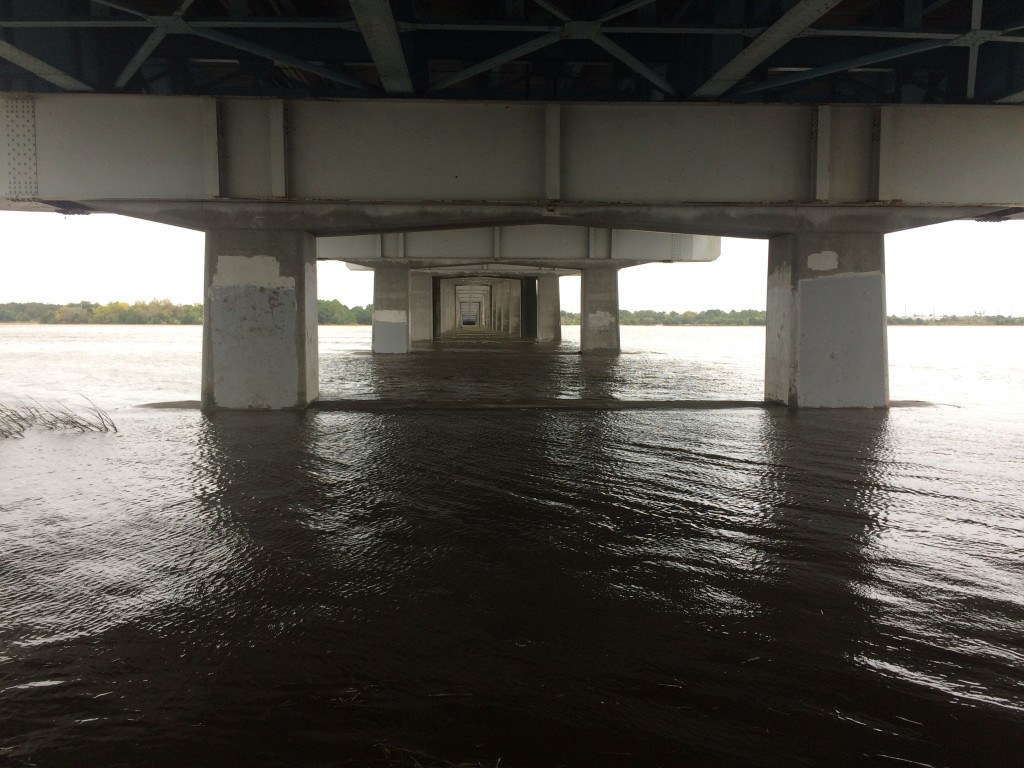
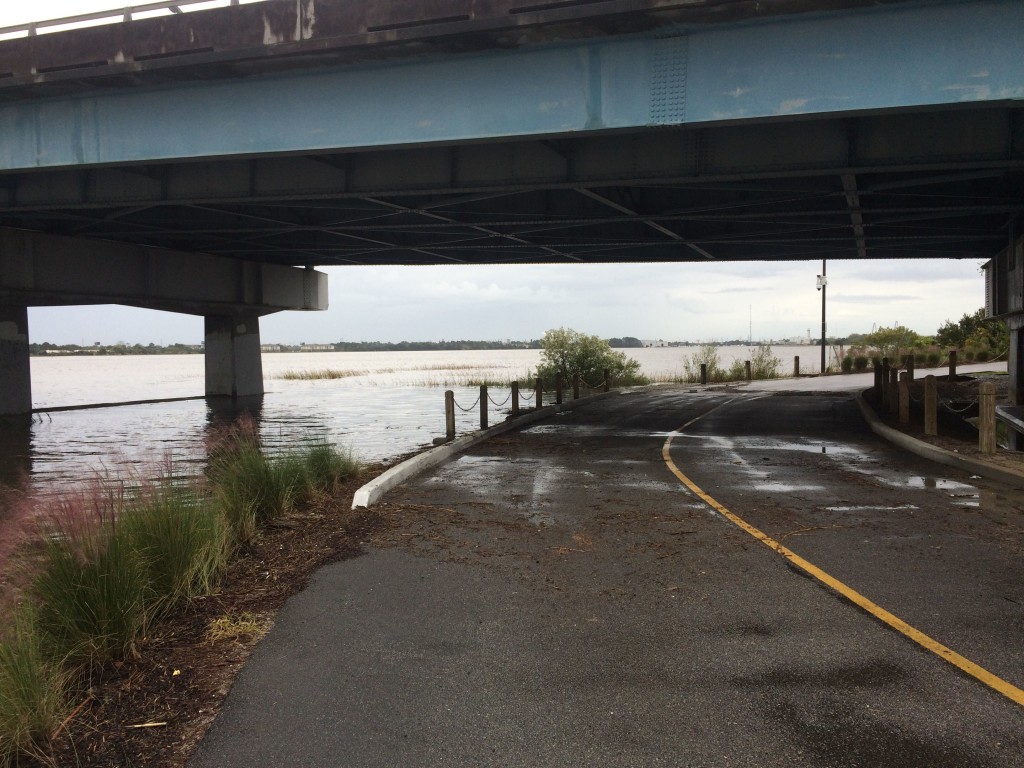
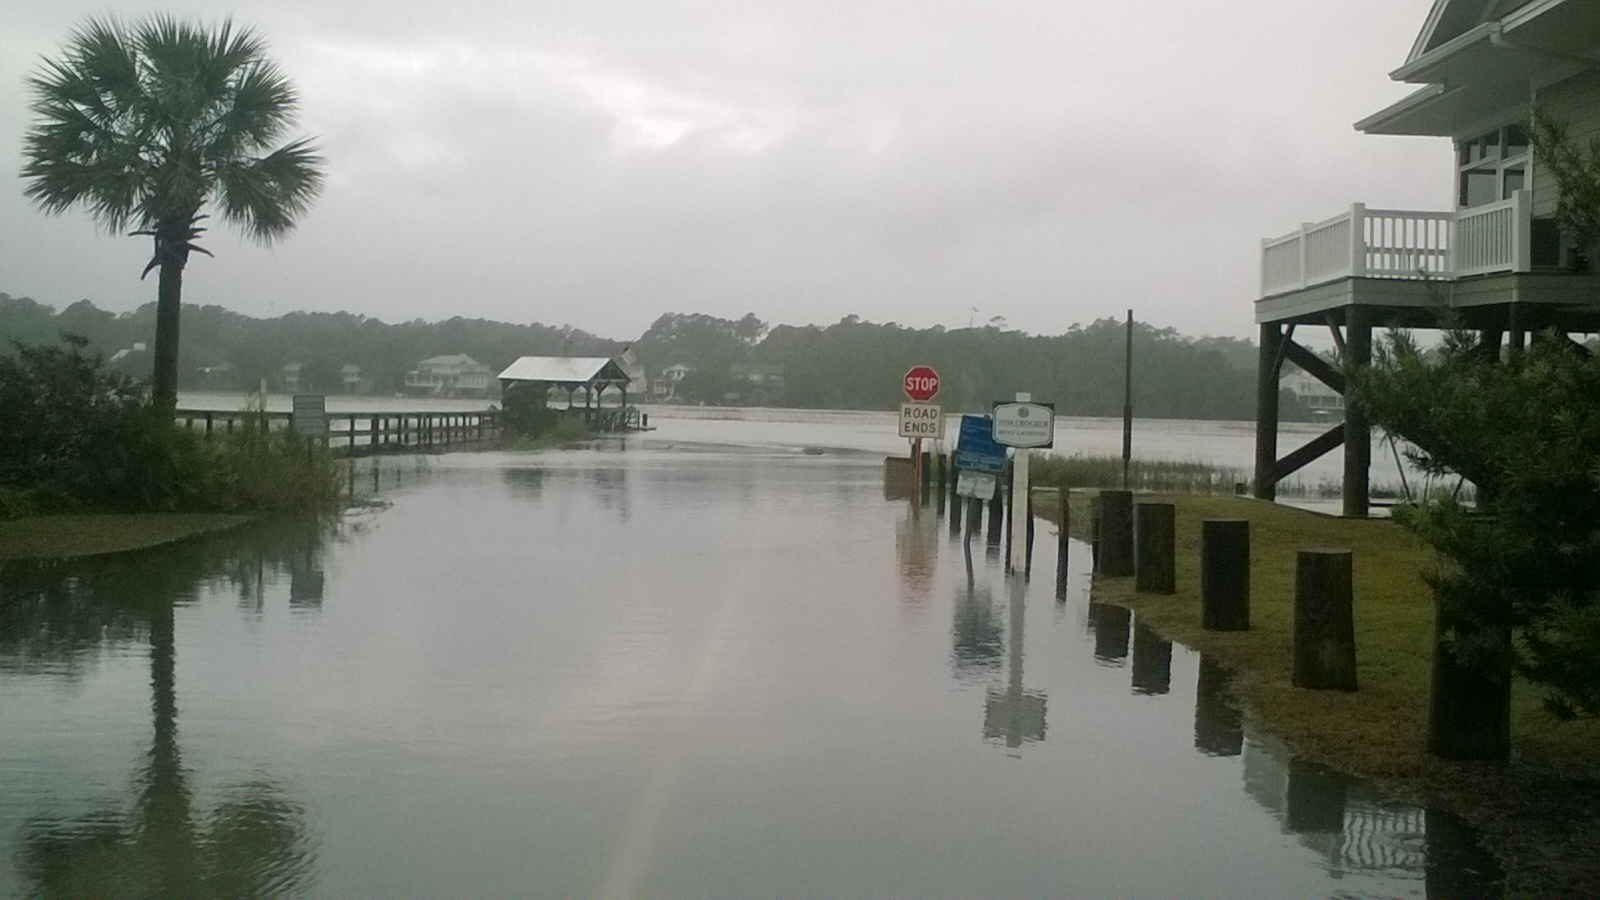
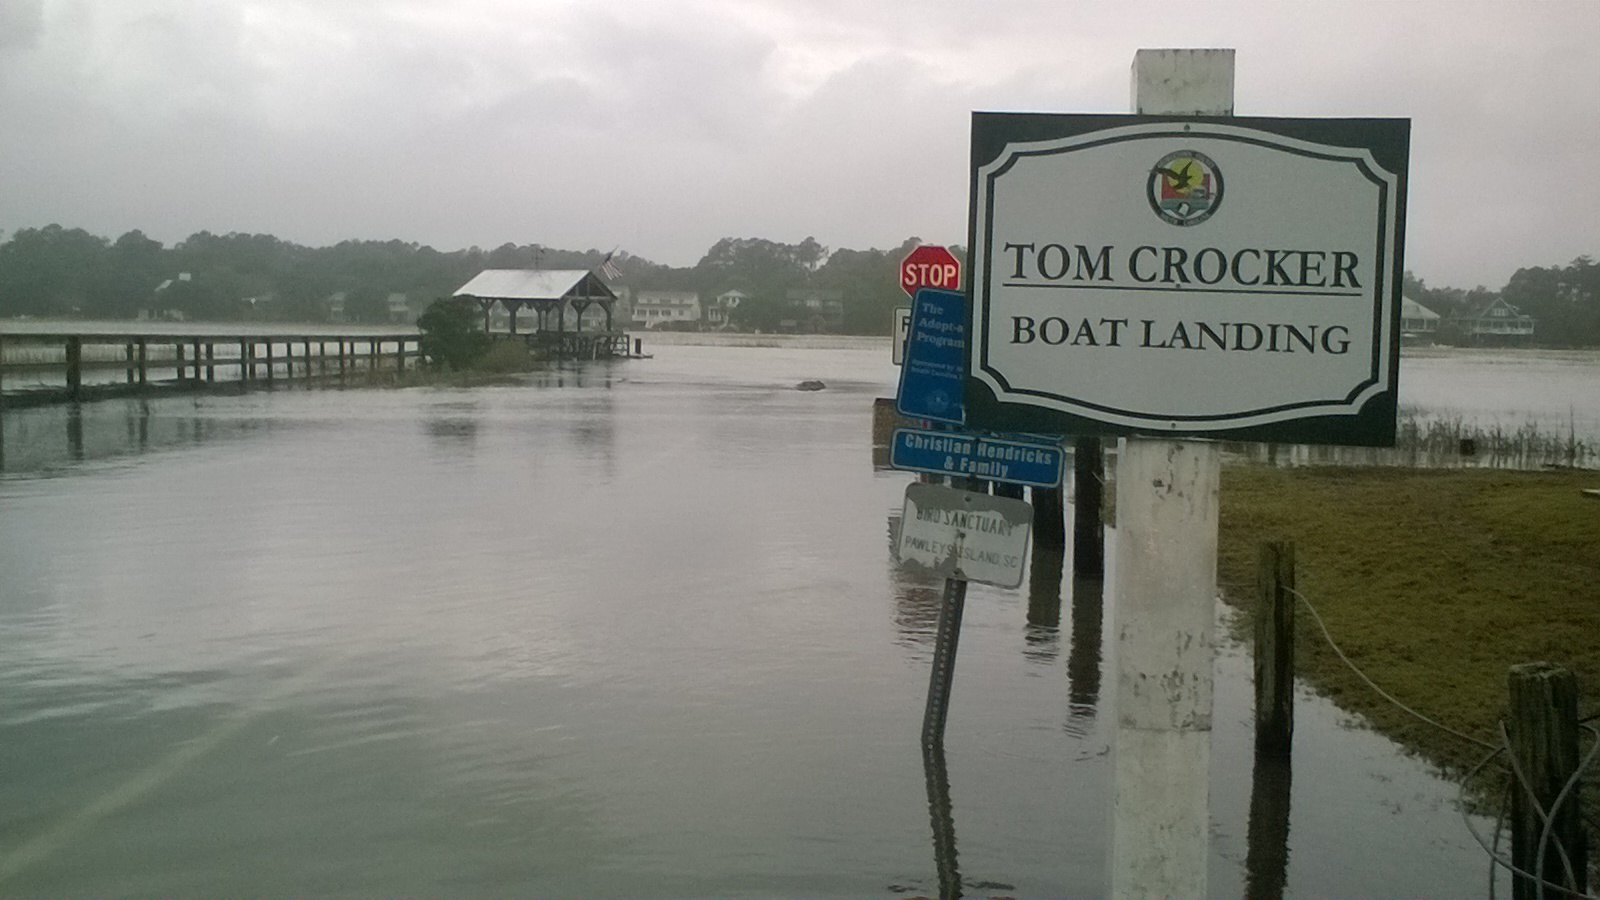
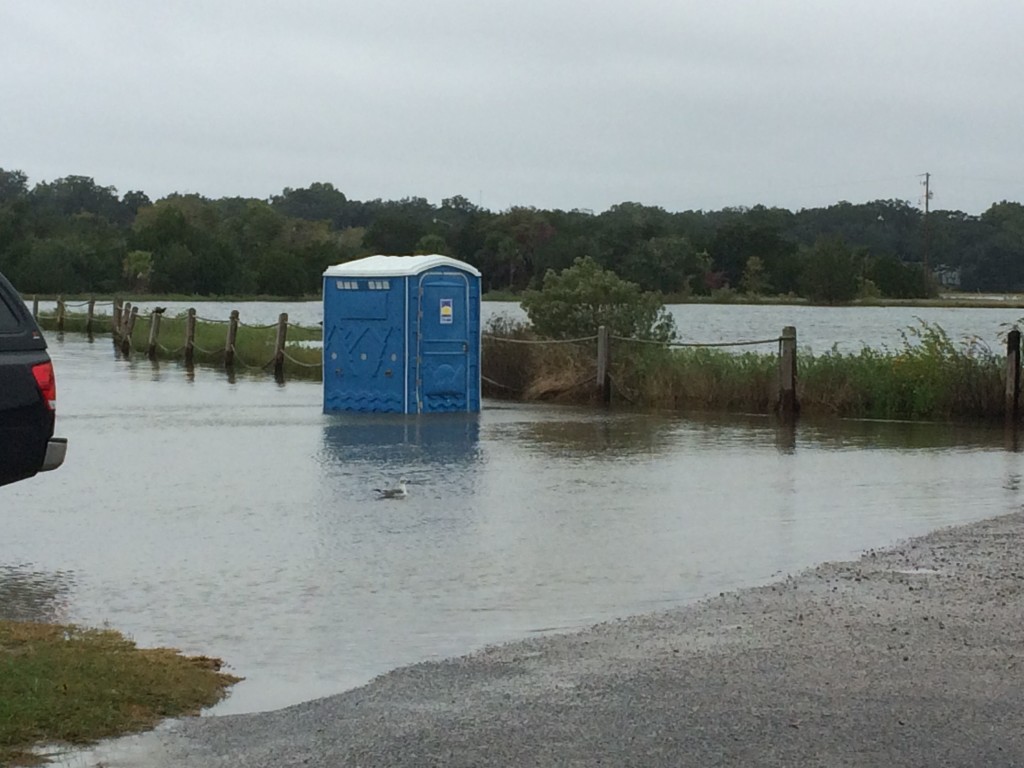
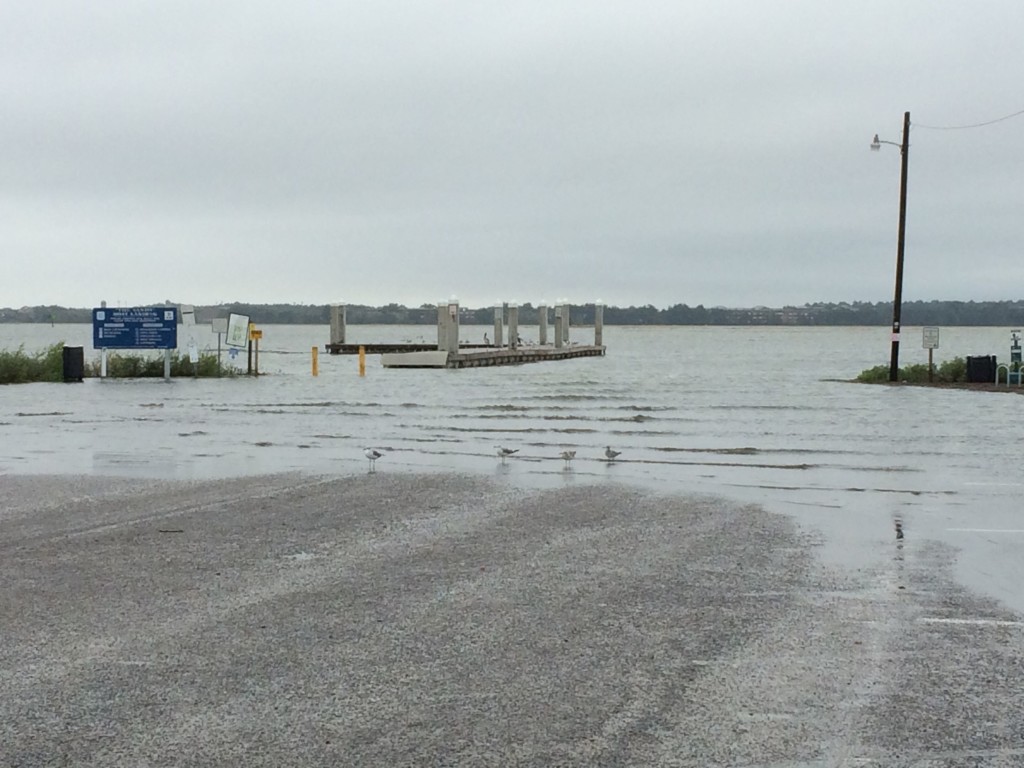
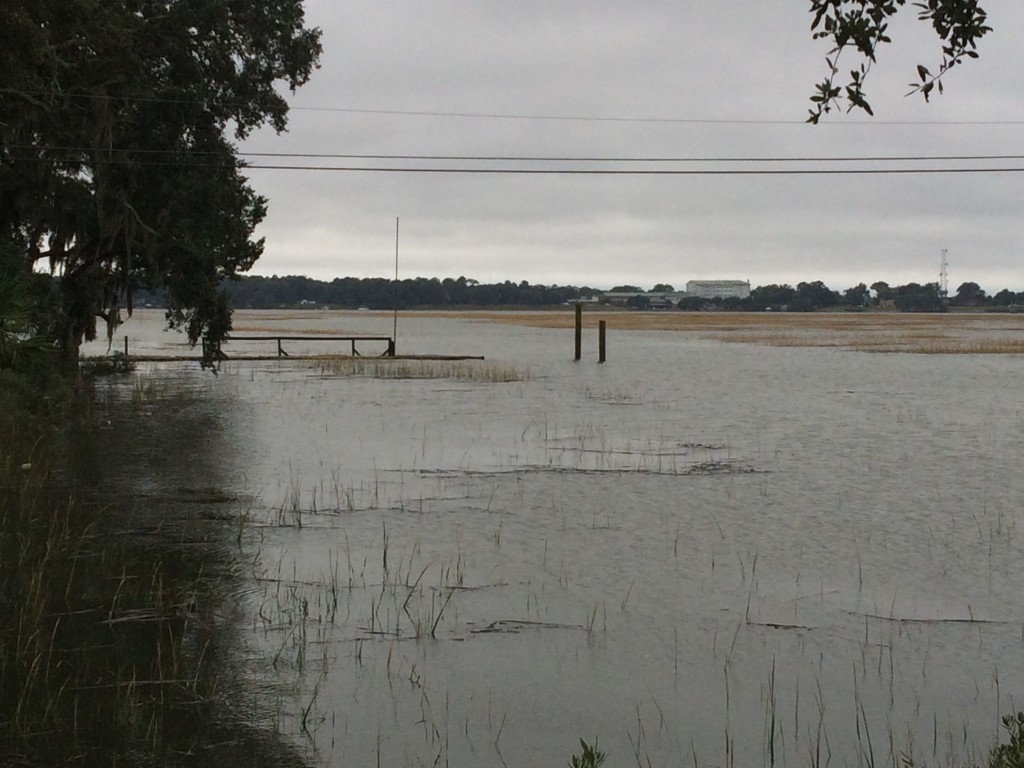
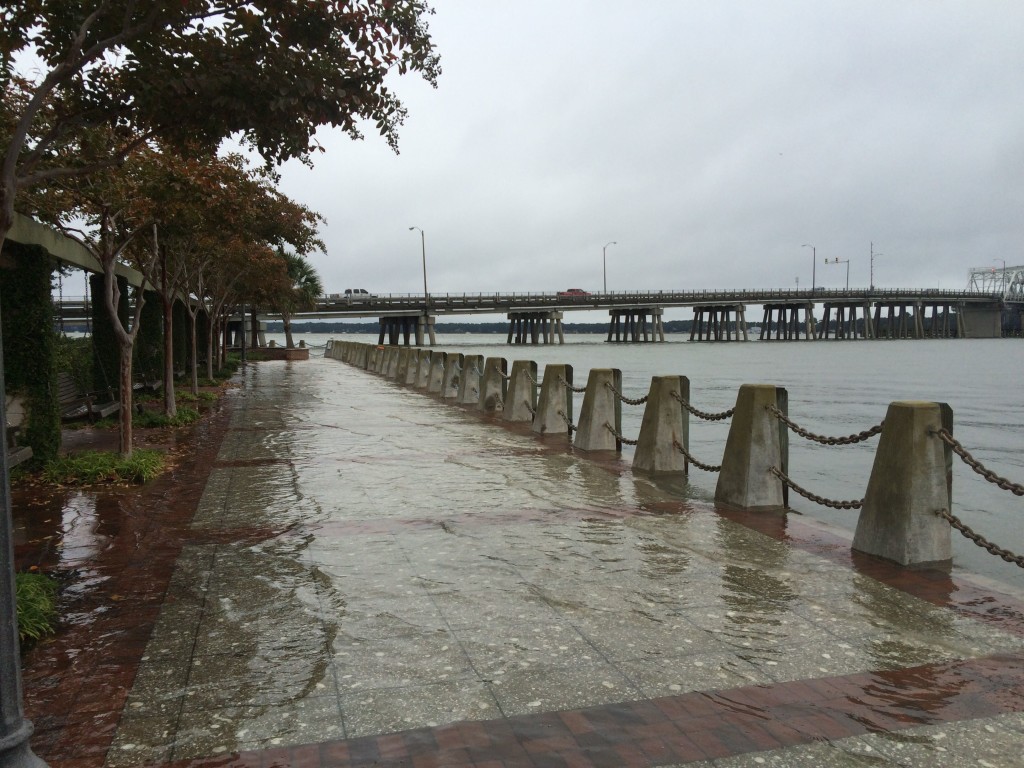
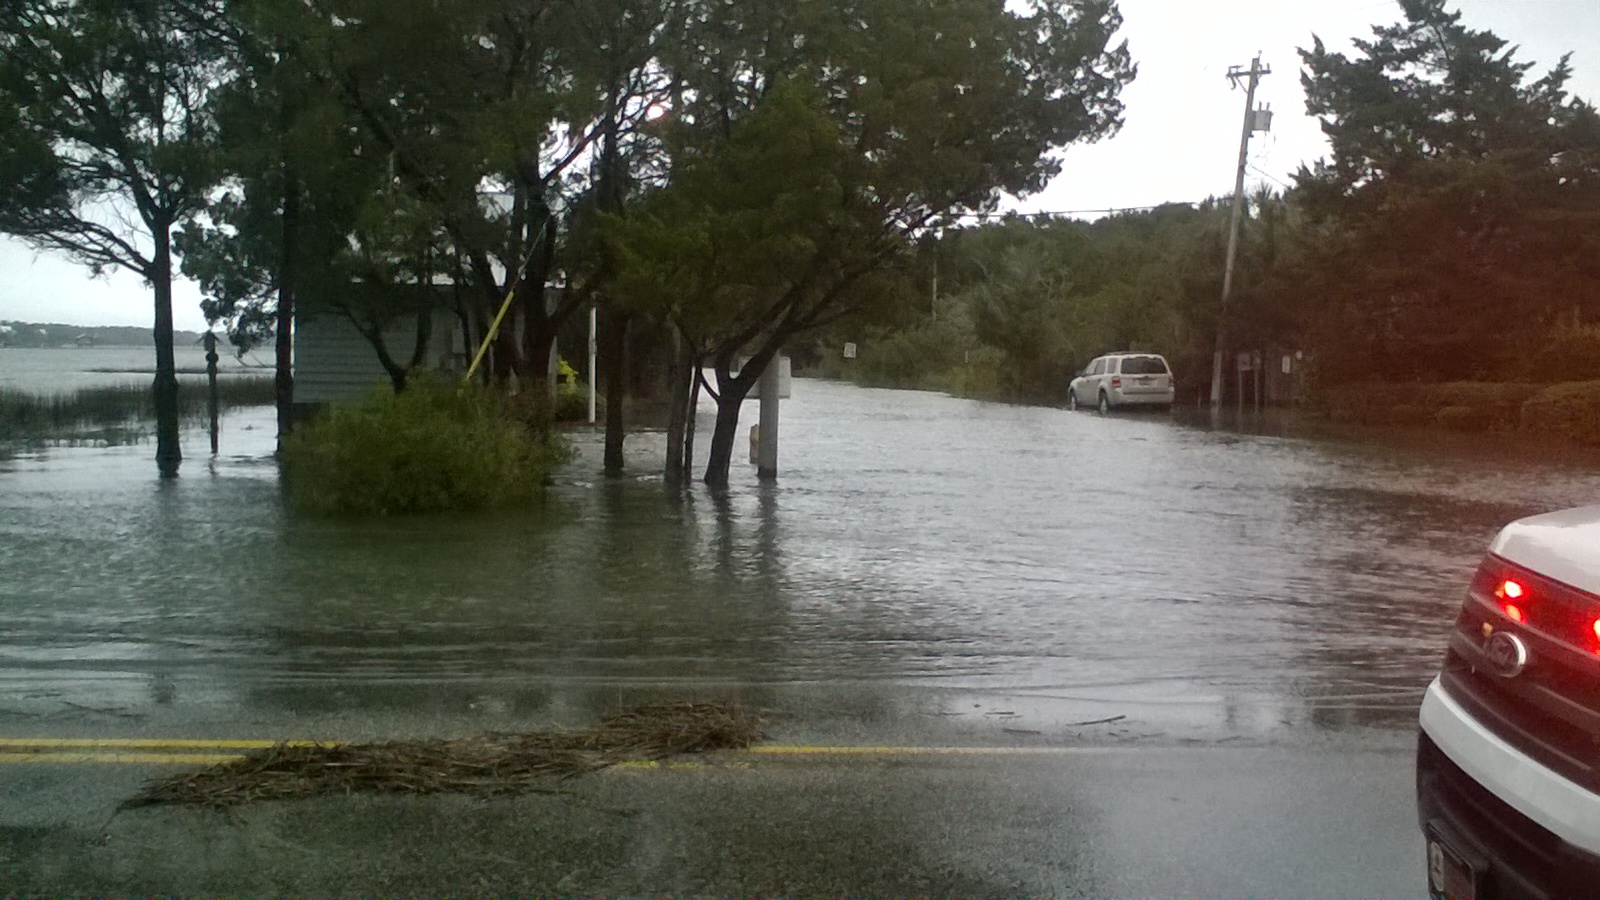
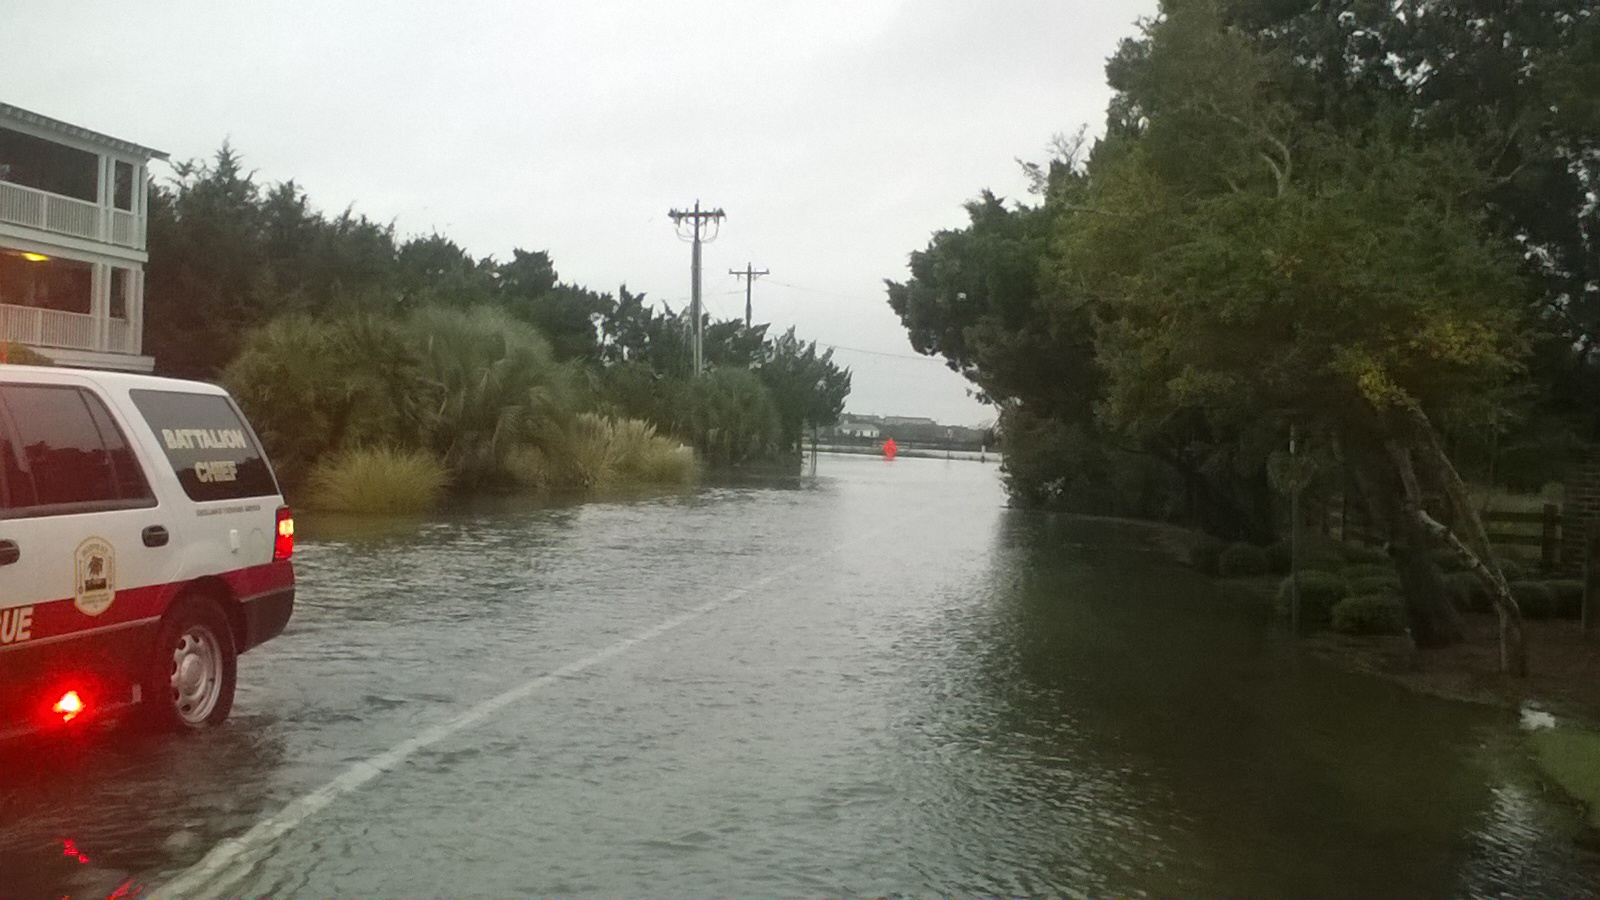
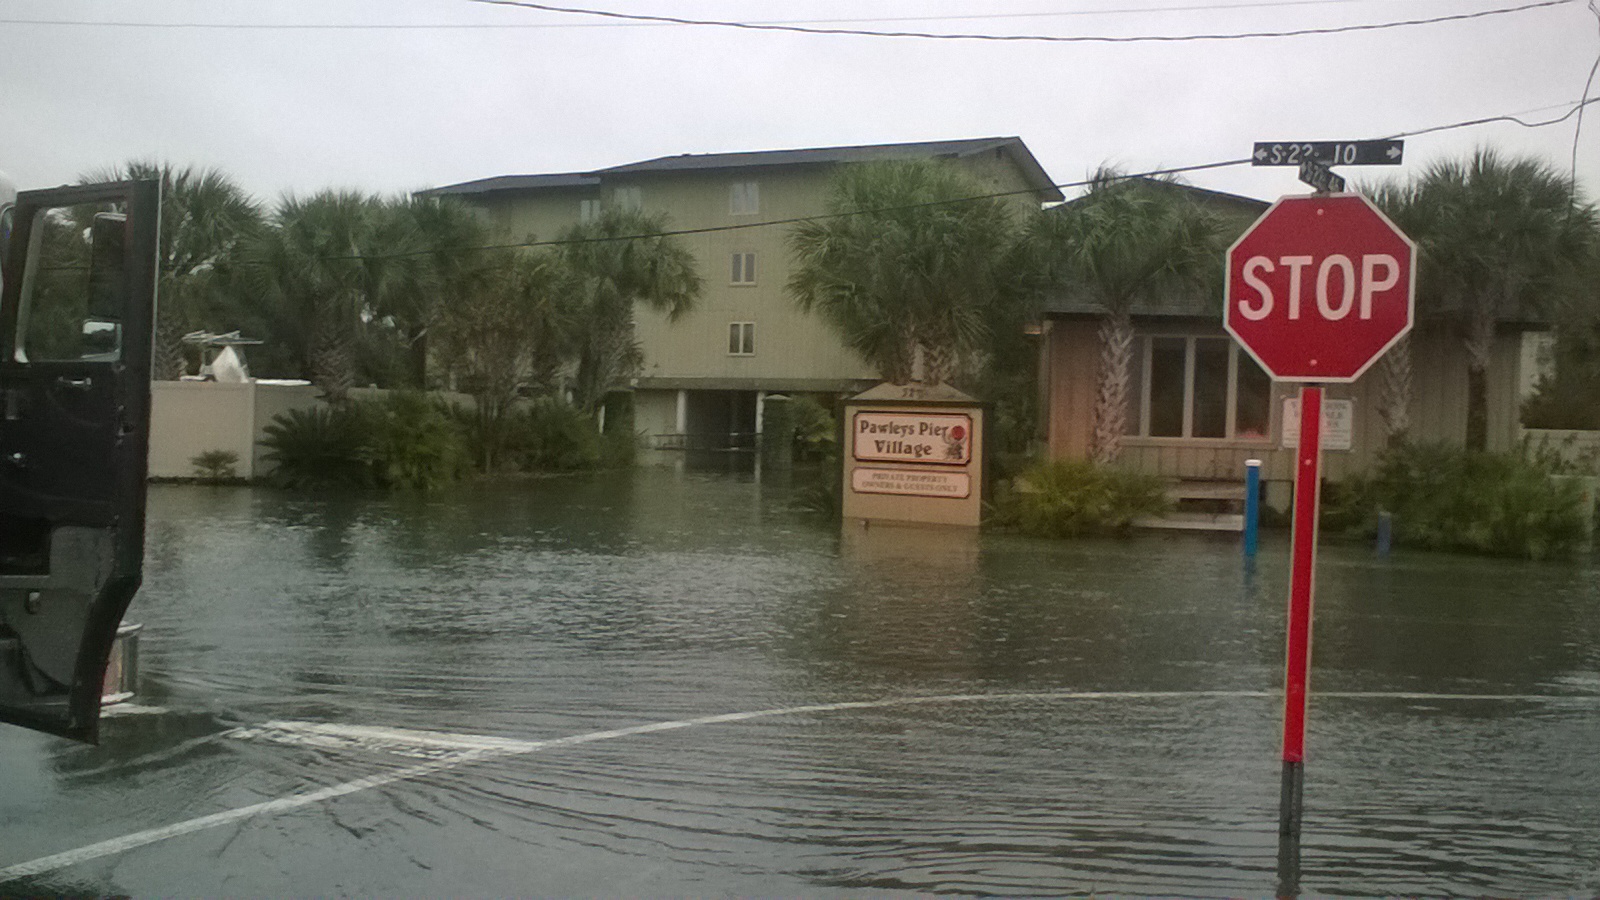
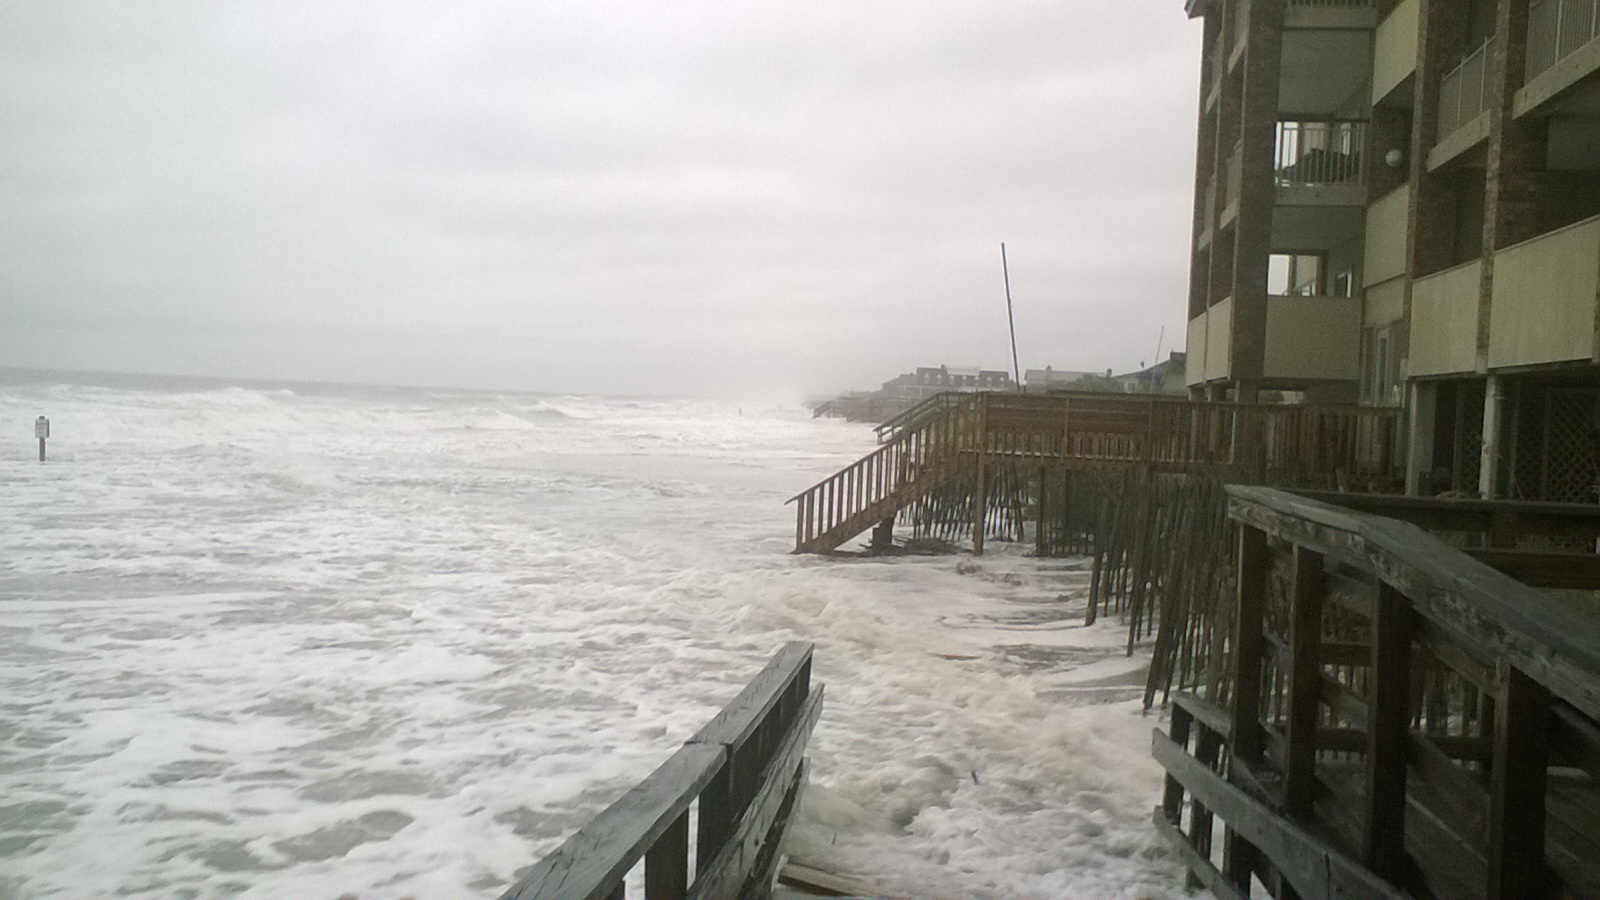
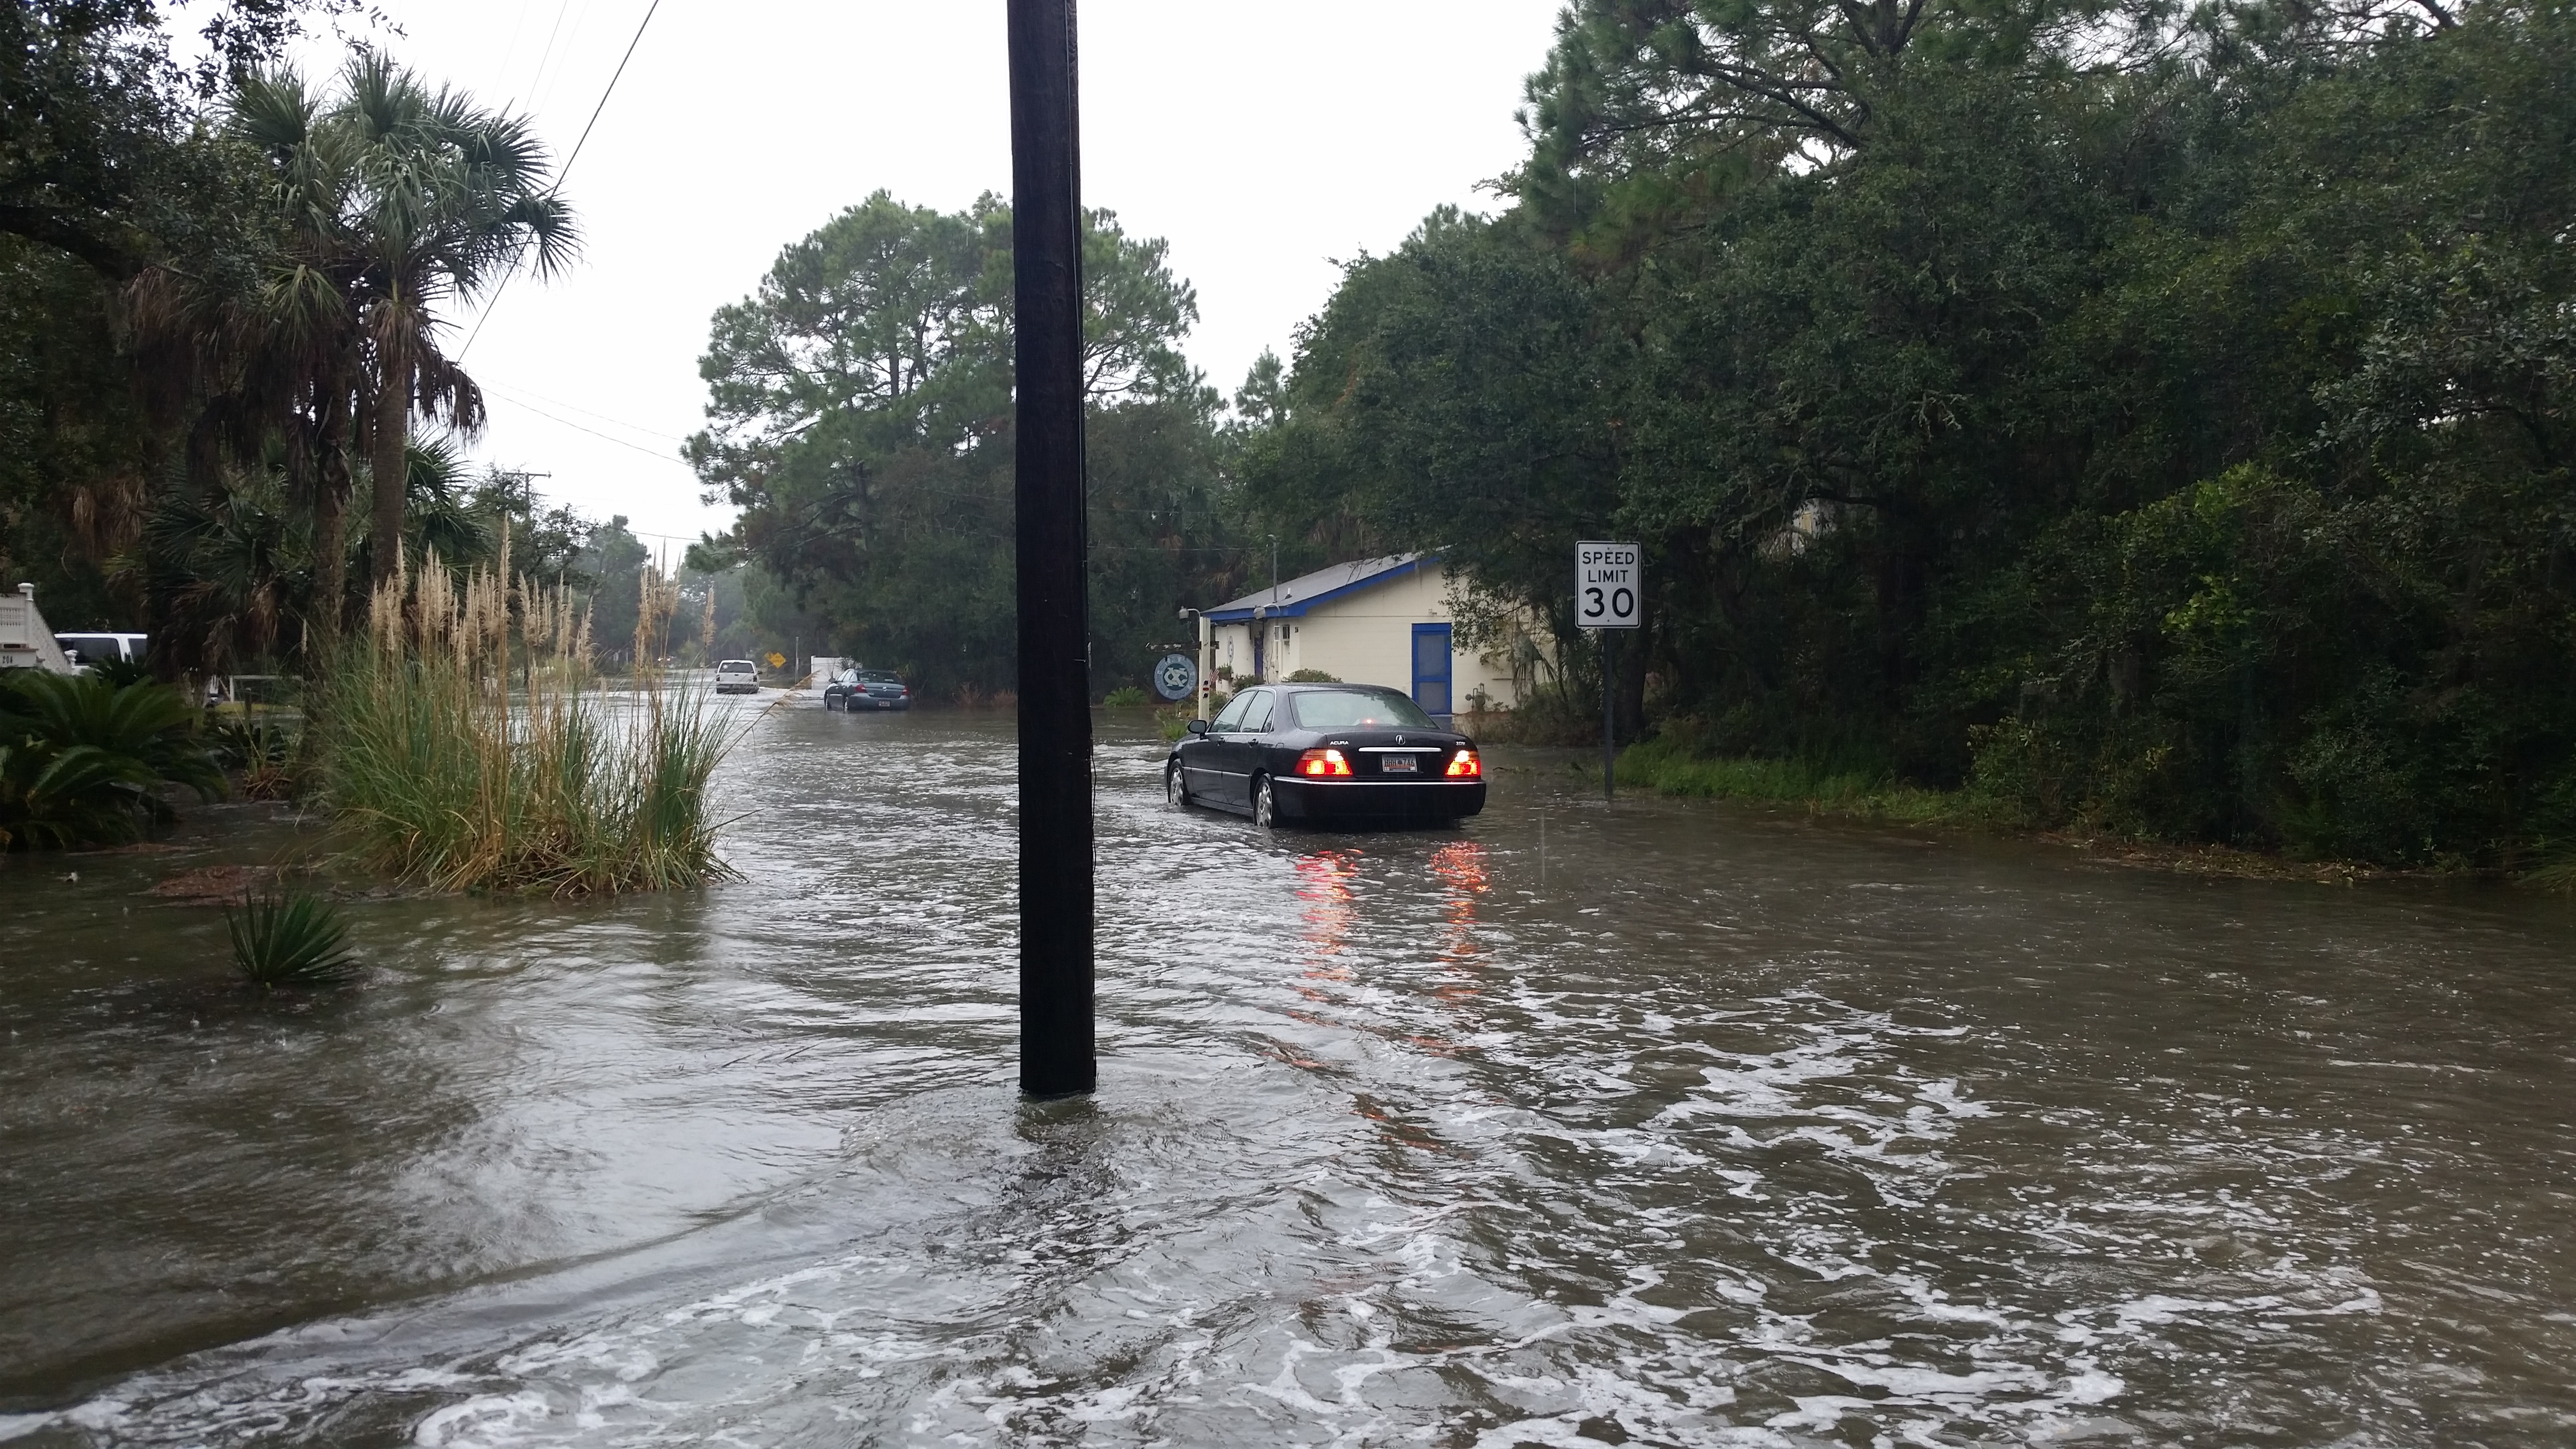
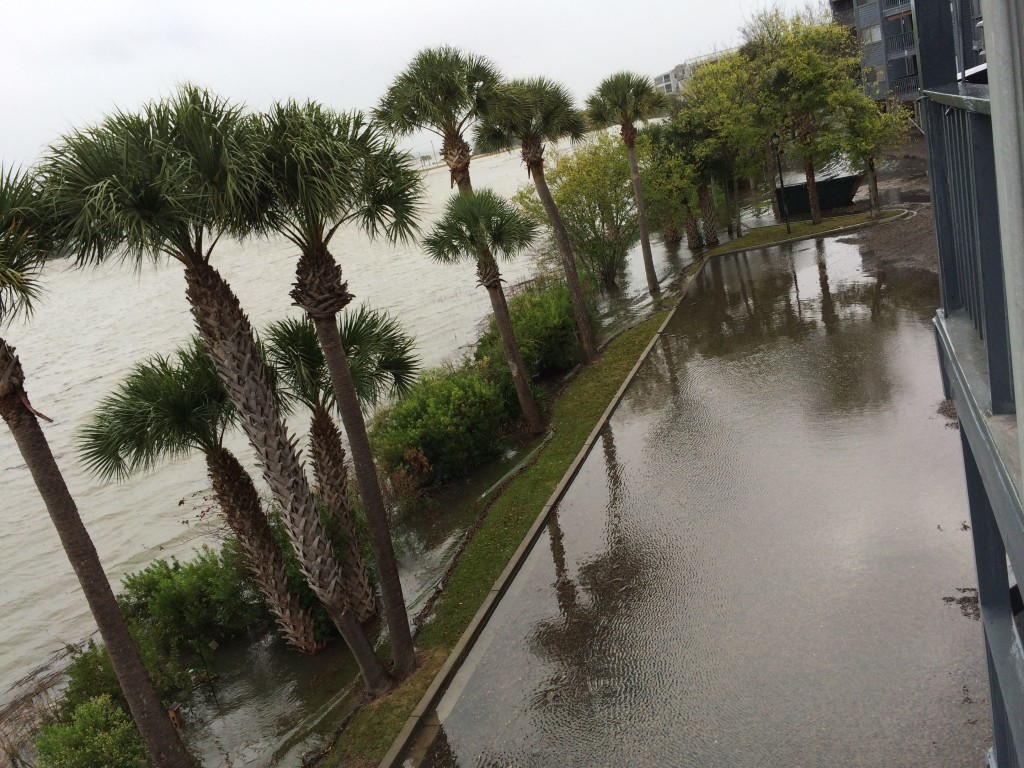
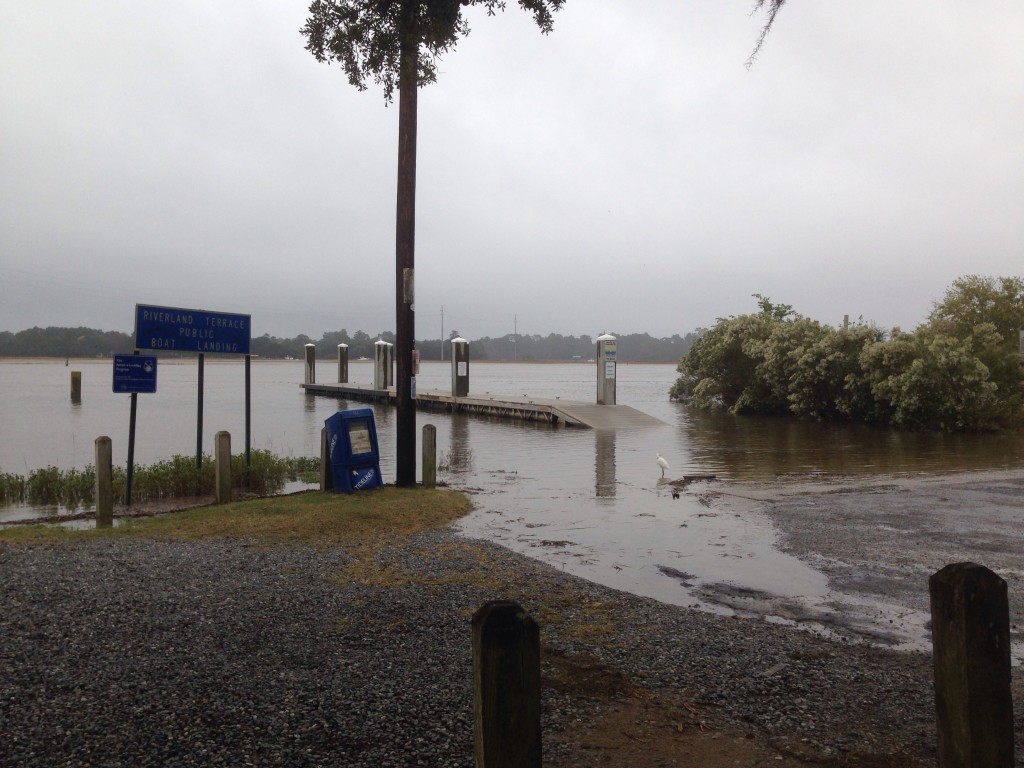
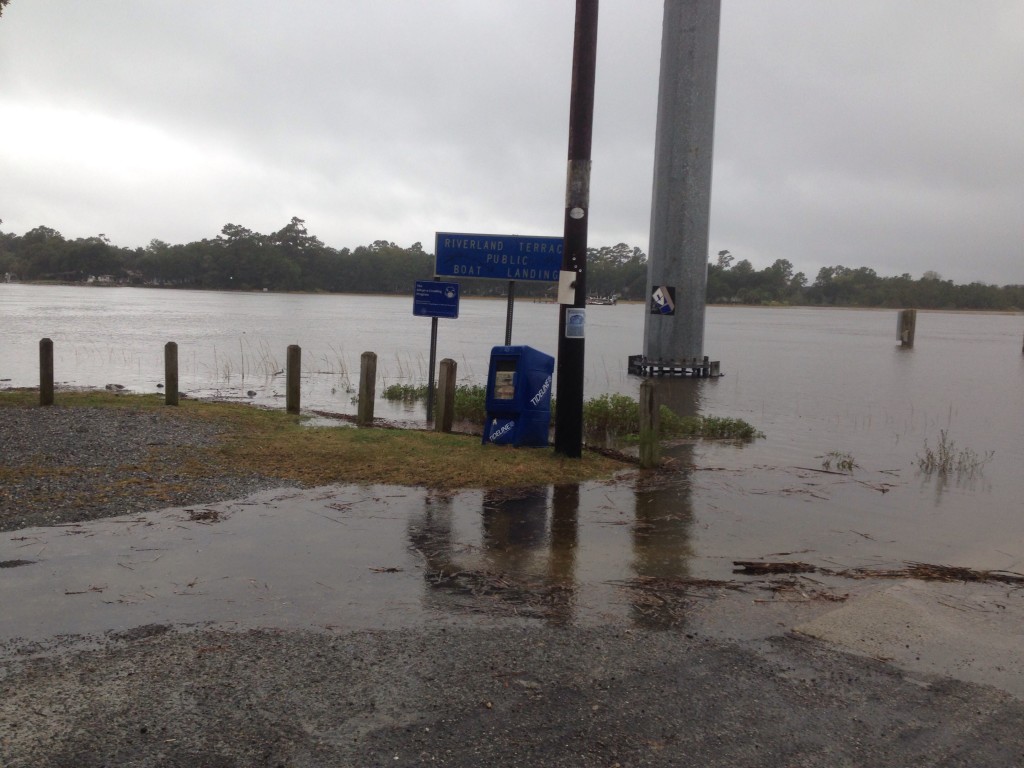
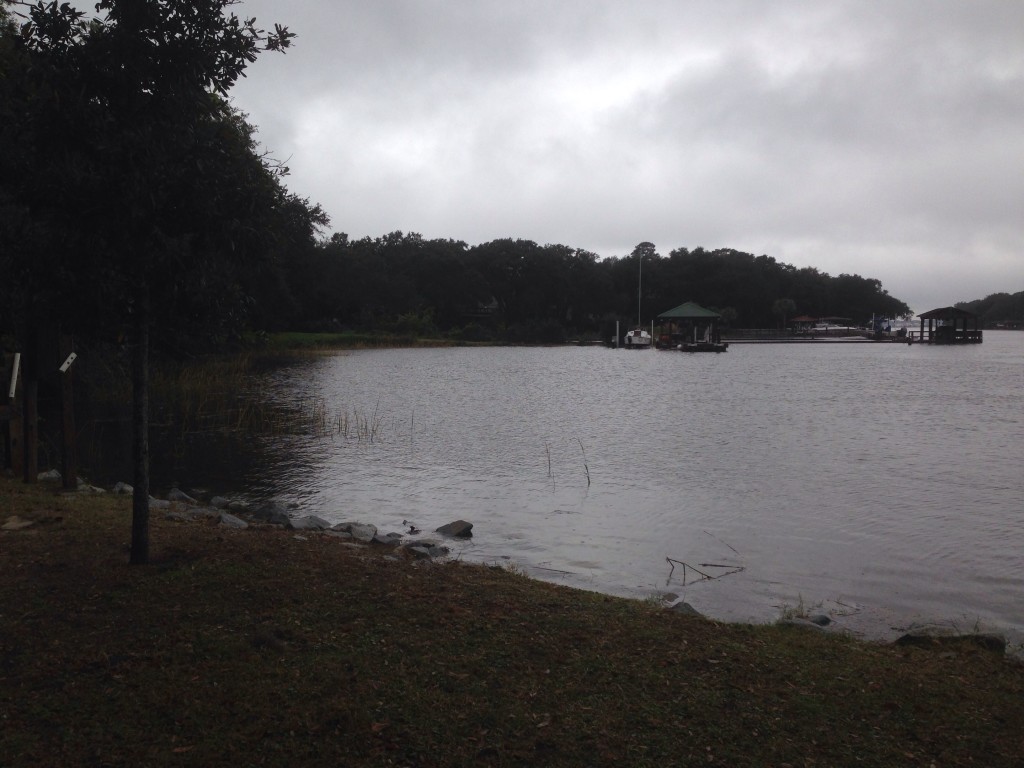
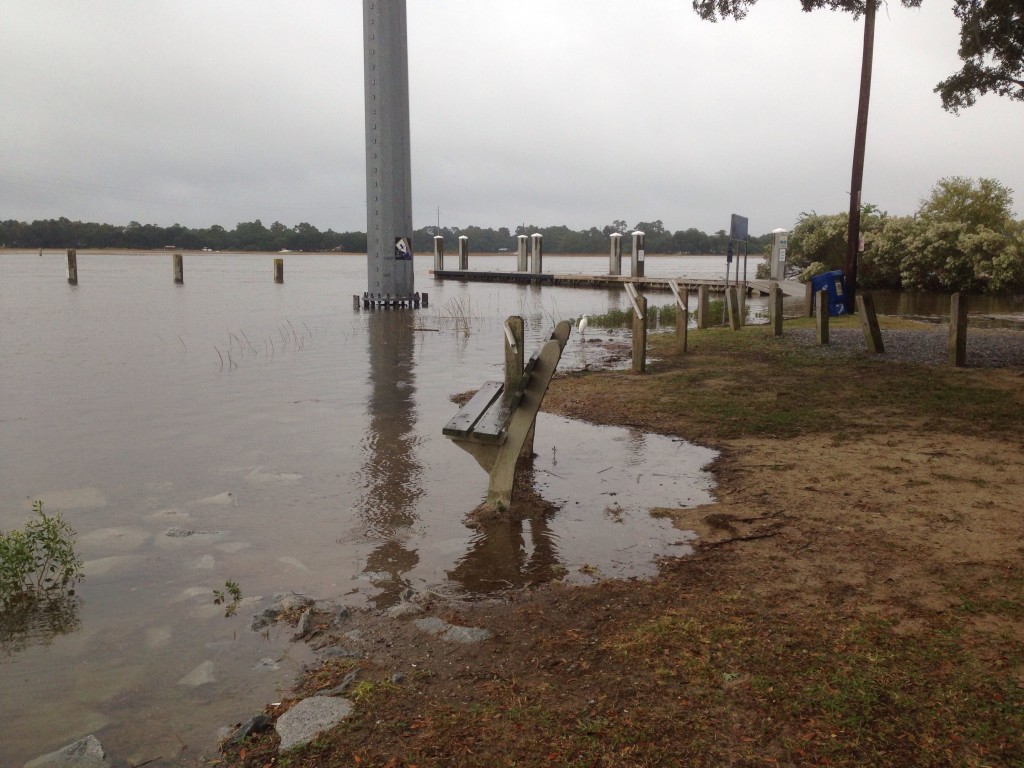
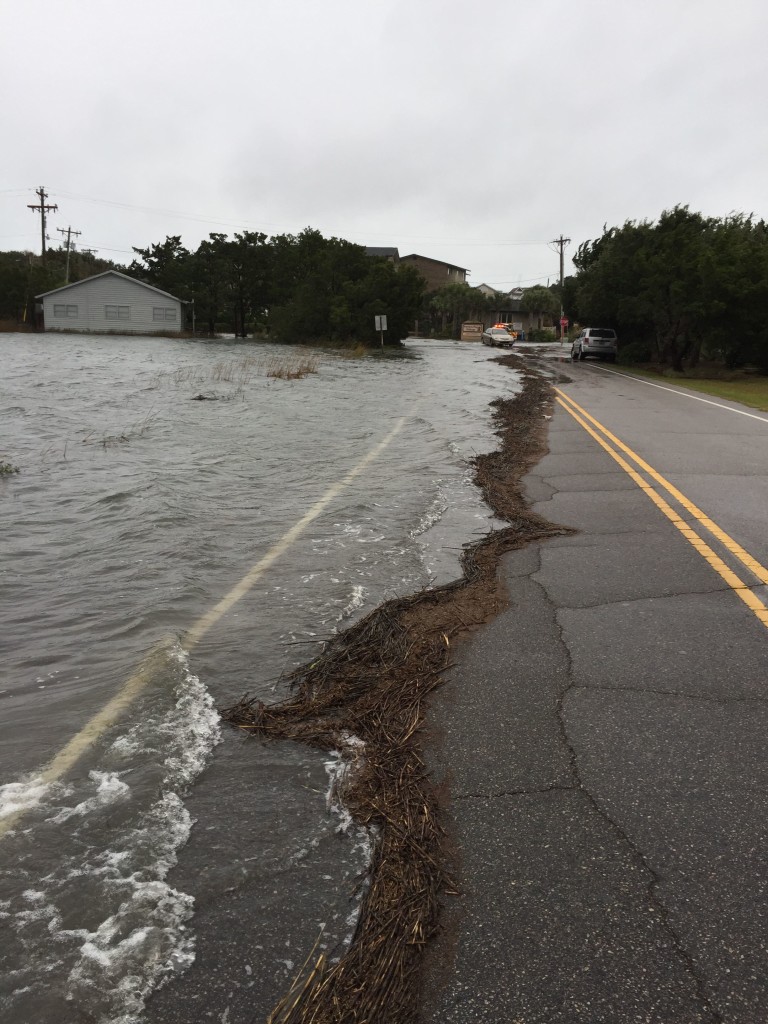
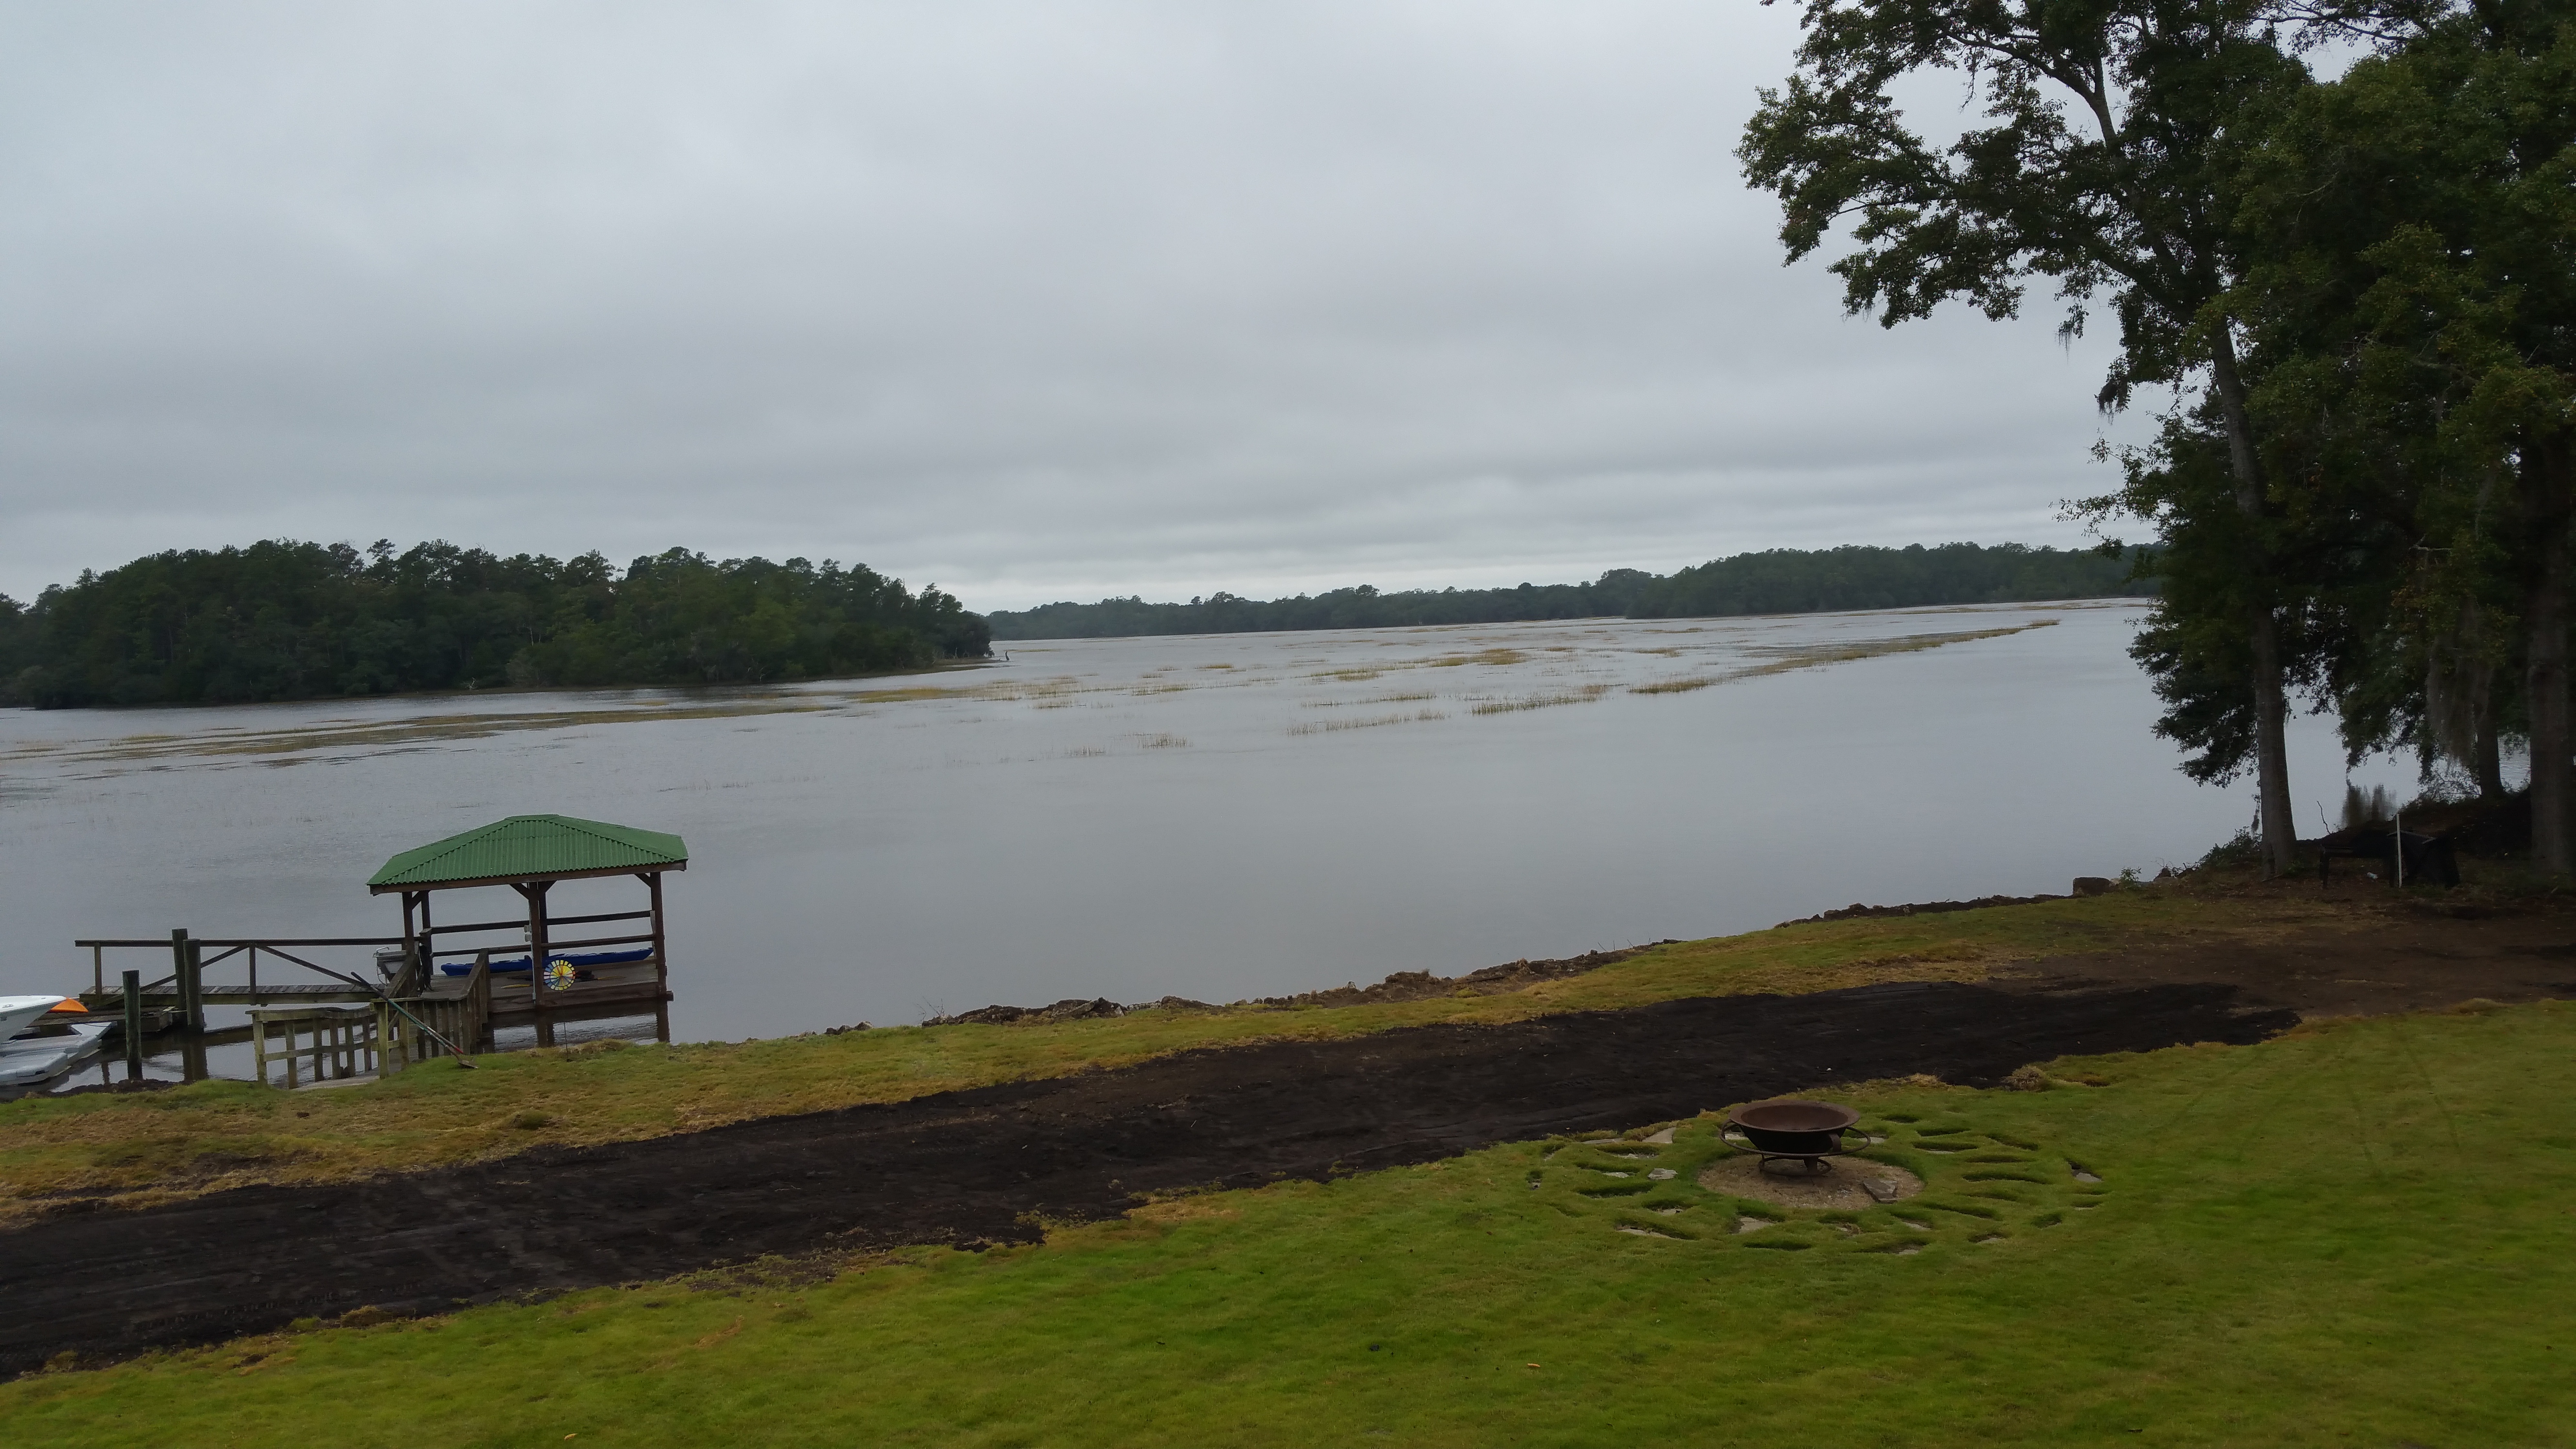
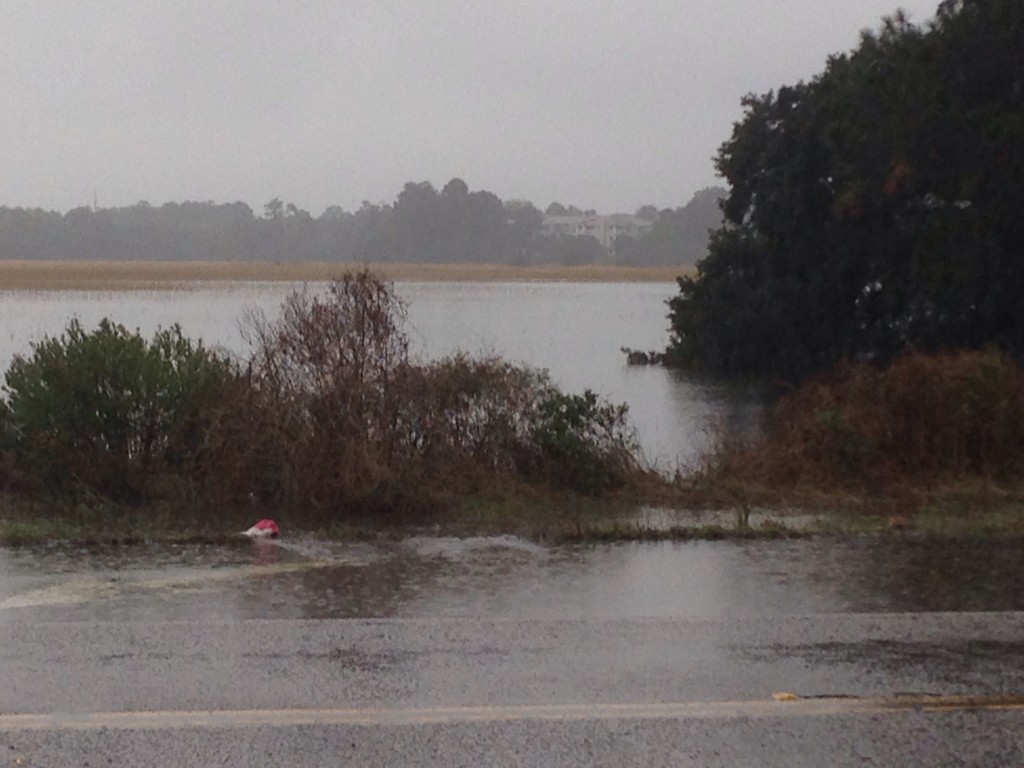
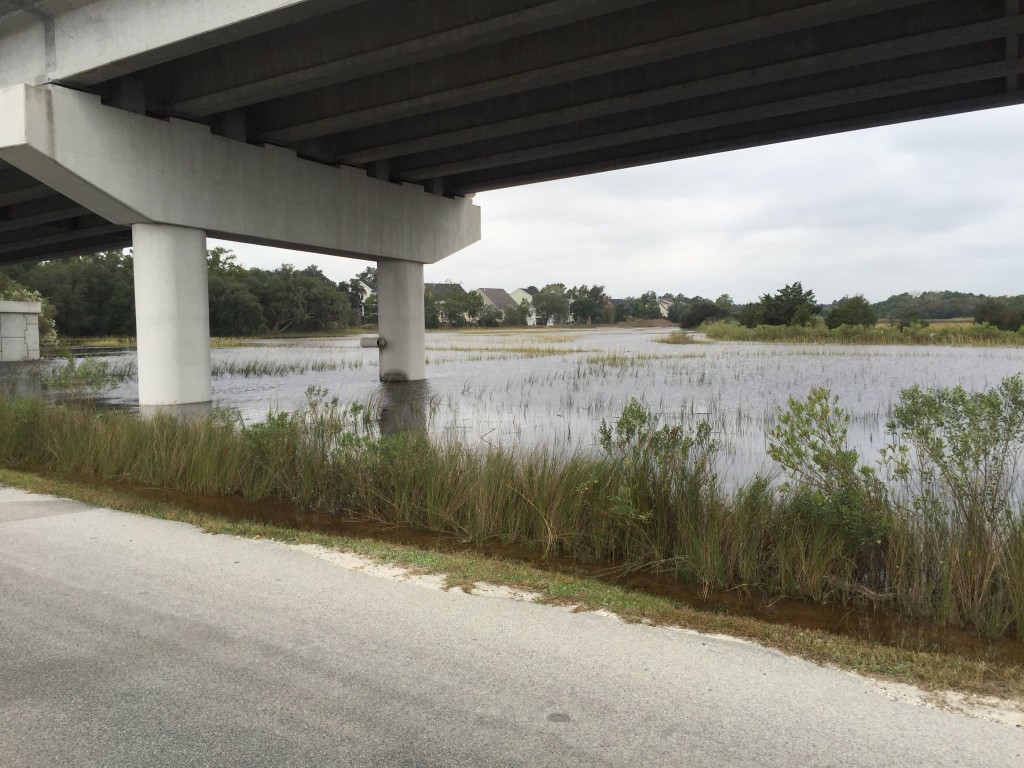
In Charleston Harbor, the highest water levels of the year (and since Hurricane Hugo in 1989) were observed on Tuesday, October 27th. Water levels peaked at 8.7’ mean lower low water (MLLW) at 8:36 a.m., a foot and a half above astronomical predictions, prompting extensive road closures throughout the coast. The Charleston Harbor Tide Station recorded water levels at, or above, 7’ MLLW for nearly 4 hours. This series consisted of 14 observed King Tides over 9 days – significantly exceeding the 6 events over 6 days that were predicted. The morning tide observed on October 27th was the fourth highest tide on record in the Harbor since monitoring began at this location in 1899.
| DATE | AM/PM | KING TIDE PREDICTED? | KING TIDE OBSERVED? | PREDICTED WATER LEVEL | OBSERVED WATER LEVEL | DIFFERENCE |
|---|---|---|---|---|---|---|
| October 24 | AM | No | Yes | 6.2 | 6.7 | 0.5 |
| October 24 | PM | No | Yes | 6.4 | 7.2 | 0.8 |
| October 25 | AM | Yes | Yes | 6.6 | 7.4 | 0.8 |
| October 25 | PM | No | Yes | 6.5 | 7.2 | 0.7 |
| October 26 | AM | Yes | Yes | 7 | 7.7 | 0.7 |
| October 26 | PM | No | Yes | 6.5 | 7.7 | 1.2 |
| October 27 | AM | Yes | Yes | 7.2 | 8.7 | 1.5 |
| October 27 | PM | No | Yes | 6.5 | 7.8 | 1.3 |
| October 28 | AM | Yes | Yes | 7.2 | 8.3 | 1.1 |
| October 28 | PM | No | Yes | 6.3 | 6.9 | 0.6 |
| October 29 | AM | Yes | Yes | 7.1 | 7.5 | 0.4 |
| October 30 | AM | Yes | Yes | 6.9 | 6.9 | 0.0 |
| October 31 | AM | No | Yes | 6.5 | 7 | 0.5 |
| November 1 | AM | No | Yes | 6.2 | 6.6 | 0.4 |